Nokia 2006 Annual Report Download - page 69
Download and view the complete annual report
Please find page 69 of the 2006 Nokia annual report below. You can navigate through the pages in the report by either clicking on the pages listed below, or by using the keyword search tool below to find specific information within the annual report.-
 1
1 -
2
-
3
-
4
-
5
-
6
-
7
-
8
-
9
-
10
-
11
-
12
-
13
-
14
-
15
-
16
-
17
-
18
-
19
-
20
-
21
-
22
-
23
-
24
-
25
-
26
-
27
-
28
-
29
-
30
-
31
-
32
-
33
-
34
-
35
-
36
-
37
-
38
-
39
-
40
-
41
-
42
-
43
-
44
-
45
-
46
-
47
-
48
-
49
-
50
-
51
-
52
-
53
-
54
-
55
-
56
-
57
-
58
-
 59
59 -
 60
60 -
 61
61 -
 62
62 -
 63
63 -
 64
64 -
 65
65 -
 66
66 -
 67
67 -
 68
68 -
 69
69 -
 70
70 -
 71
71 -
 72
72 -
 73
73 -
 74
74 -
 75
75 -
 76
76 -
 77
77 -
 78
78 -
 79
79 -
80
-
81
-
82
-
83
-
84
-
85
-
86
-
87
-
88
-
89
-
90
-
91
-
92
-
93
-
94
-
95
-
96
-
97
-
98
-
99
-
100
-
101
-
102
-
103
-
104
-
105
-
106
-
107
-
108
-
109
-
110
-
111
-
112
-
113
-
114
-
115
-
116
-
117
-
118
-
119
-
120
-
121
-
122
-
123
-
124
-
125
-
126
-
127
-
128
-
129
-
130
-
131
-
132
-
133
-
134
-
135
-
136
-
137
-
138
-
139
-
140
-
141
-
142
-
143
-
144
-
145
-
146
-
147
-
148
-
149
-
150
-
151
-
152
-
153
-
154
-
155
-
156
-
157
-
158
-
159
-
160
-
161
-
162
-
163
-
164
-
165
-
166
-
167
-
168
-
169
-
170
-
171
-
172
-
173
-
174
-
175
-
176
-
177
-
178
-
179
-
180
-
181
-
182
-
183
-
184
-
185
-
186
-
187
-
188
-
189
-
190
-
191
-
192
-
193
-
194
-
195
-
196
-
197
-
198
-
199
-
200
-
201
-
202
-
203
-
204
-
205
-
206
-
207
-
208
-
209
-
210
-
211
-
212
-
213
-
214
-
215
-
216
 |
 |

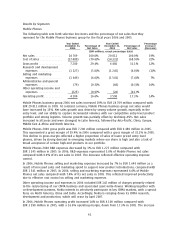
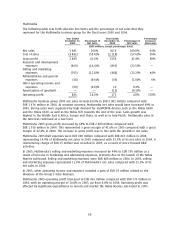
Multimedia
The following table sets forth selective line items and the percentage of net sales that they
represent for the Multimedia business group for the fiscal years 2005 and 2004.
Year Ended Year Ended Percentage
December 31, Percentage of December 31, Percentage of Increase/
2005 Net Sales 2004 Net Sales (Decrease)
(EUR millions, except percentage data)
Net sales ****************** 5 981 100% 3676 100.0% 63%
Cost of sales *************** (3 492) (58.4)% (2 118) (57.6)% 65%
Gross profit **************** 2 489 41.6% 1558 42.4% 60%
Research and development
expenses **************** (860) (14.4)% (863) (23.5)% —
Selling and marketing
expenses **************** (705) (11.8)% (488) (13.2)% 44%
Administrative and general
expenses **************** (38) (0.6)% (36) (1.0)% 6%
Other operating income and
expenses **************** (50) (0.8)% 16 0.4% —
Amortization of goodwill **** — — (12) (0.3)% —
Operating profit ************ 836 14.0% 175 4.8% 378%
Multimedia business group 2005 net sales increased 63% to EUR 5 981 million compared with
EUR 3 676 million in 2004. At constant currency, Multimedia net sales would have increased 69% in
2005. Strong sales were supported by high demand for 3G/WCDMA devices such as the Nokia 6680
and the Nokia 6630, as well as the Nokia N70 towards the end of the year. Sales growth was
highest in the Middle East & Africa, Europe and China, as well as in AsiaPacific. Multimedia sales in
the Americas continued at a low level.
Multimedia 2005 gross profit increased by 60% to EUR 2 489 million compared with
EUR 1 558 million in 2004. This represented a gross margin of 41.6% in 2005 compared with a gross
margin of 42.4% in 2004. The increase in gross profit was in line with the growth in net sales.
Multimedia 2005 R&D expenses were EUR 860 million compared with EUR 863 million in 2004,
representing 14.4% of Multimedia net sales in 2005 compared with 23.5% of its net sales in 2004. A
restructuring charge of EUR 15 million was recorded in 2005, as a result of more focused R&D
activities.
In 2005, Multimedia’s selling and marketing expenses increased by 44% to EUR 705 million as a
result of increase in marketing and advertising expenses, primarily due to the launch of the Nokia
Nseries subbrand. Selling and marketing expenses were EUR 488 million in 2004. In 2005, selling
and marketing expenses represented 11.8% of Multimedia’s net sales compared with 13.2% of its
net sales in 2004.
In 2005, other operating income and expenses included a gain of EUR 19 million related to the
divesture of the Group’s Tetra business.
Multimedia 2005 operating profit increased to EUR 836 million compared with EUR 175 million in
2004, with an operating margin of 14.0% in 2005, up from 4.8% in 2004. Operating profit was
affected by significant expenditures to launch and market the Nokia Nseries subbrand in 2005.
68