Nokia 2006 Annual Report Download - page 13
Download and view the complete annual report
Please find page 13 of the 2006 Nokia annual report below. You can navigate through the pages in the report by either clicking on the pages listed below, or by using the keyword search tool below to find specific information within the annual report.-
 1
1 -
2
-
 3
3 -
 4
4 -
 5
5 -
 6
6 -
 7
7 -
 8
8 -
 9
9 -
 10
10 -
 11
11 -
 12
12 -
 13
13 -
 14
14 -
 15
15 -
 16
16 -
 17
17 -
 18
18 -
 19
19 -
 20
20 -
 21
21 -
 22
22 -
 23
23 -
24
-
25
-
26
-
27
-
28
-
29
-
30
-
31
-
32
-
33
-
34
-
35
-
36
-
37
-
38
-
39
-
40
-
41
-
42
-
43
-
44
-
45
-
46
-
47
-
48
-
49
-
50
-
51
-
52
-
53
-
54
-
55
-
56
-
57
-
58
-
59
-
60
-
61
-
62
-
63
-
64
-
65
-
66
-
67
-
68
-
69
-
70
-
71
-
72
-
73
-
74
-
75
-
76
-
77
-
78
-
79
-
80
-
81
-
82
-
83
-
84
-
85
-
86
-
87
-
88
-
89
-
90
-
91
-
92
-
93
-
94
-
95
-
96
-
97
-
98
-
99
-
100
-
101
-
102
-
103
-
104
-
105
-
106
-
107
-
108
-
109
-
110
-
111
-
112
-
113
-
114
-
115
-
116
-
117
-
118
-
119
-
120
-
121
-
122
-
123
-
124
-
125
-
126
-
127
-
128
-
129
-
130
-
131
-
132
-
133
-
134
-
135
-
136
-
137
-
138
-
139
-
140
-
141
-
142
-
143
-
144
-
145
-
146
-
147
-
148
-
149
-
150
-
151
-
152
-
153
-
154
-
155
-
156
-
157
-
158
-
159
-
160
-
161
-
162
-
163
-
164
-
165
-
166
-
167
-
168
-
169
-
170
-
171
-
172
-
173
-
174
-
175
-
176
-
177
-
178
-
179
-
180
-
181
-
182
-
183
-
184
-
185
-
186
-
187
-
188
-
189
-
190
-
191
-
192
-
193
-
194
-
195
-
196
-
197
-
198
-
199
-
200
-
201
-
202
-
203
-
204
-
205
-
206
-
207
-
208
-
209
-
210
-
211
-
212
-
213
-
214
-
215
-
216
 |
 |

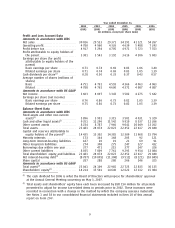
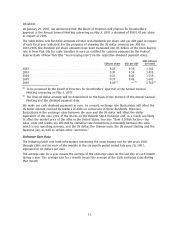
Exchange Rates
Rate at Average Highest Lowest
For the year ended December 31: period end rate rate rate
(USD per EUR)
2002 ************************************************* 1.0485 0.9495 1.0485 0.8594
2003 ************************************************* 1.2597 1.1411 1.2597 1.0361
2004 ************************************************* 1.3538 1.2478 1.3625 1.1801
2005 ************************************************* 1.1842 1.2400 1.3476 1.1667
2006 ************************************************* 1.3197 1.2661 1.3327 1.1860
For the month ended:
September 30, 2006 *********************************** 1.2687 1.2722 1.2833 1.2648
October 31, 2006 ************************************** 1.2773 1.2617 1.2773 1.2502
November 30, 2006************************************ 1.3261 1.2888 1.3261 1.2705
December 31, 2006 ************************************ 1.3197 1.3205 1.3327 1.3073
January 31, 2007 ************************************** 1.2998 1.2993 1.3286 1.2904
February 28, 2007 ************************************* 1.3230 1.3080 1.3246 1.2933
On February 28, 2007, the noon buying rate was USD 1.3230 per EUR 1.00.
3.B Capitalization and Indebtedness
Not applicable.
3.C Reasons for the Offer and Use of Proceeds
Not applicable.
3.D Risk Factors
Set forth below is a description of factors that may affect our business, results of operations and
share price from time to time.
We need to have a competitive product portfolio with products that are preferred by our
current and potential customers to those of our competitors. In order to have this, we need
to understand the different markets in which we operate, and meet the needs of our
customers, which include mobile network operators, distributors, independent retailers,
corporate customers and consumers. Our failure to identify key market trends and to respond
timely and successfully to the needs of our customers may have a material adverse impact on
our market share, business and results of operations.
In order to meet our customers’ needs, we need to have a competitive product portfolio with
products that are preferred to those of our competitors. For Nokia, a competitive mobile device
product portfolio means a broad and balanced offering of commercially appealing mobile devices
with attractive aesthetics, design, features and functionality for all major consumer segments and
price points supported by the Nokia brand, quality and competitive cost structure. In our networks
business, a competitive product portfolio means for us a highquality offering of products designed
to meet the requirements of our customers and local markets, supported by quality and a
competitive cost structure.
In order to have a competitive product portfolio, we need to understand the different markets in
which we operate and meet the needs of our customers. We serve a diverse range of mobile device
and infrastructure customers, ranging from mobile network operators, distributors, independent
retailers, corporate customers to consumers, across a variety of markets. In many of these markets,
the mobile communications industry is at different stages of development, and many of these
markets have different characteristics and dynamics, for example, in terms of mobile penetration
12