Nokia 2006 Annual Report Download - page 178
Download and view the complete annual report
Please find page 178 of the 2006 Nokia annual report below. You can navigate through the pages in the report by either clicking on the pages listed below, or by using the keyword search tool below to find specific information within the annual report.-
 1
1 -
2
-
3
-
4
-
5
-
6
-
7
-
8
-
9
-
10
-
11
-
12
-
13
-
14
-
15
-
16
-
17
-
18
-
19
-
20
-
21
-
22
-
23
-
24
-
25
-
26
-
27
-
28
-
29
-
30
-
31
-
32
-
33
-
34
-
35
-
36
-
37
-
38
-
39
-
40
-
41
-
42
-
43
-
44
-
45
-
46
-
47
-
48
-
49
-
50
-
51
-
52
-
53
-
54
-
55
-
56
-
57
-
58
-
59
-
60
-
61
-
62
-
63
-
64
-
65
-
66
-
67
-
68
-
69
-
70
-
71
-
72
-
73
-
74
-
75
-
76
-
77
-
78
-
79
-
80
-
81
-
82
-
83
-
84
-
85
-
86
-
87
-
88
-
89
-
90
-
91
-
92
-
93
-
94
-
95
-
96
-
97
-
98
-
99
-
100
-
101
-
102
-
103
-
104
-
105
-
106
-
107
-
108
-
109
-
110
-
111
-
112
-
113
-
114
-
115
-
116
-
117
-
118
-
119
-
120
-
121
-
122
-
123
-
124
-
125
-
126
-
127
-
128
-
129
-
130
-
131
-
132
-
133
-
134
-
135
-
136
-
137
-
138
-
139
-
140
-
141
-
142
-
143
-
144
-
145
-
146
-
147
-
148
-
149
-
150
-
151
-
152
-
153
-
154
-
155
-
156
-
157
-
158
-
159
-
160
-
161
-
162
-
163
-
164
-
165
-
166
-
167
-
 168
168 -
 169
169 -
 170
170 -
 171
171 -
 172
172 -
 173
173 -
 174
174 -
 175
175 -
 176
176 -
 177
177 -
 178
178 -
 179
179 -
 180
180 -
 181
181 -
 182
182 -
 183
183 -
 184
184 -
 185
185 -
 186
186 -
 187
187 -
 188
188 -
189
-
190
-
191
-
192
-
193
-
194
-
195
-
196
-
197
-
198
-
199
-
200
-
201
-
202
-
203
-
204
-
205
-
206
-
207
-
208
-
209
-
210
-
211
-
212
-
213
-
214
-
215
-
216
 |
 |

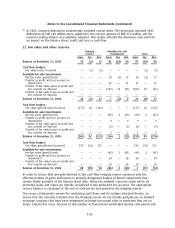
Notes to the Consolidated Financial Statements (Continued)
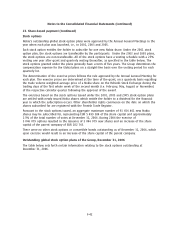
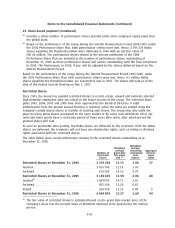
23. Sharebased payment (Continued)
Vesting status
Stock Number (as percentage Exercise
Exercise period
Plan options of partici of total number price/
(year of out pants Option (sub) of stock options First vest Last vest Expiry share
launch) standing (approx.) category outstanding) date date date EUR
2001(1),(2) 44 978 614 24 000 2001A+B Expired July 1, 2002 July 1, 2005 December 31, 2006 36.75
2001C3Q/01 Expired October 1, 2002 October 3, 2005 December 31, 2006 20.61
2001C4Q/01 Expired January 2, 2003 January 2, 2006 December 31, 2006 26.67
2001C1Q/02 100.00 April 1, 2003 April 3, 2006 December 31, 2007 26.06
2001C3Q/02 100.00 October 1, 2003 October 2, 2006 December 31, 2007 12.99
2001C4Q/02 93.75 January 2, 2004 January 2, 2007 December 31, 2007 16.86
2002A+B 100.00 July 1, 2003 July 3, 2006 December 31, 2007 17.89
2003(2) 29 255 968 19 000 2003 2Q 81.25 July 1, 2004 July 2, 2007 December 31, 2008 14.95
2003 3Q 75.00 October 1, 2004 October 1, 2007 December 31, 2008 12.71
2003 4Q 68.75 January 3, 2005 January 2, 2008 December 31, 2008 15.05
2004 2Q 56.25 July 1, 2005 July 1, 2008 December 31, 2009 11.79
2004 3Q 50.00 October 3, 2005 October 1, 2008 December 31, 2009 9.44
2004 4Q 43.75 January 2, 2006 January 2, 2009 December 31, 2009 12.35
2005(2) 17 421 819 5 000 2005 2Q 31.25 July 1, 2006 July 1, 2009 December 31, 2010 12.79
2005 3Q 25.00 October 1, 2006 October 1, 2009 December 31, 2010 13.09
2005 4Q 0.00 January 1, 2007 January 1, 2010 December 31, 2010 14.48
2006 1Q 0.00 April 1, 2007 April 1, 2010 December 31, 2011 14.99
2006 2Q 0.00 July 1, 2007 July 1, 2010 December 31, 2011 18.02
2006 3Q 0.00 October 1, 2007 October 1, 2010 December 31, 2011 15.37
2006 4Q 0.00 January 1, 2008 January 1, 2011 December 31, 2011 15.38
(1) The stock options under the 2001 plan are listed on the Helsinki Stock Exchange.
(2) The Group’s current global stock option plans have a vesting schedule with 25% vesting
one year after grant, and quarterly vesting thereafter, each of the quarterly lots representing
6.25% of the total grant. The grants vest fully in four years.
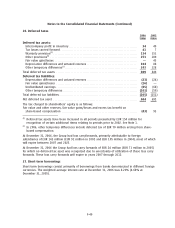
Other employee equity plans
In addition to the global equity plans described above, the Group has equity plans for Nokia
acquired businesses or employees in the United States or Canada, under which participants can
receive Nokia ADSs. These equity plans do not result in an increase in the share capital of Nokia. In
2006, a new such plan was launched, under which performance shares, stock options and restricted
shares can be granted, resulting to transfer of existing ordinary shares or Nokia ADSs.
On the basis of these stock option plans the Group had 1.6 million stock options outstanding on
December 31, 2006. Each stock option entitles the holder to receive the same amount of Nokia ADSs.
The average exercise price of stock options under these plans is USD 17.48. These stock options are
included in the table below.
Treasury shares are acquired by the Group to meet its obligations under employee stock
compensation plans in the US and Canada. When treasury shares are issued on exercise of stock
options any gain or loss is recognized in share issue premium.
F43