Nokia 2006 Annual Report Download - page 180
Download and view the complete annual report
Please find page 180 of the 2006 Nokia annual report below. You can navigate through the pages in the report by either clicking on the pages listed below, or by using the keyword search tool below to find specific information within the annual report.-
 1
1 -
2
-
3
-
4
-
5
-
6
-
7
-
8
-
9
-
10
-
11
-
12
-
13
-
14
-
15
-
16
-
17
-
18
-
19
-
20
-
21
-
22
-
23
-
24
-
25
-
26
-
27
-
28
-
29
-
30
-
31
-
32
-
33
-
34
-
35
-
36
-
37
-
38
-
39
-
40
-
41
-
42
-
43
-
44
-
45
-
46
-
47
-
48
-
49
-
50
-
51
-
52
-
53
-
54
-
55
-
56
-
57
-
58
-
59
-
60
-
61
-
62
-
63
-
64
-
65
-
66
-
67
-
68
-
69
-
70
-
71
-
72
-
73
-
74
-
75
-
76
-
77
-
78
-
79
-
80
-
81
-
82
-
83
-
84
-
85
-
86
-
87
-
88
-
89
-
90
-
91
-
92
-
93
-
94
-
95
-
96
-
97
-
98
-
99
-
100
-
101
-
102
-
103
-
104
-
105
-
106
-
107
-
108
-
109
-
110
-
111
-
112
-
113
-
114
-
115
-
116
-
117
-
118
-
119
-
120
-
121
-
122
-
123
-
124
-
125
-
126
-
127
-
128
-
129
-
130
-
131
-
132
-
133
-
134
-
135
-
136
-
137
-
138
-
139
-
140
-
141
-
142
-
143
-
144
-
145
-
146
-
147
-
148
-
149
-
150
-
151
-
152
-
153
-
154
-
155
-
156
-
157
-
158
-
159
-
160
-
161
-
162
-
163
-
164
-
165
-
166
-
167
-
168
-
169
-
 170
170 -
 171
171 -
 172
172 -
 173
173 -
 174
174 -
 175
175 -
 176
176 -
 177
177 -
 178
178 -
 179
179 -
 180
180 -
 181
181 -
 182
182 -
 183
183 -
 184
184 -
 185
185 -
 186
186 -
 187
187 -
 188
188 -
 189
189 -
 190
190 -
191
-
192
-
193
-
194
-
195
-
196
-
197
-
198
-
199
-
200
-
201
-
202
-
203
-
204
-
205
-
206
-
207
-
208
-
209
-
210
-
211
-
212
-
213
-
214
-
215
-
216
 |
 |

Notes to the Consolidated Financial Statements (Continued)
23. Sharebased payment (Continued)
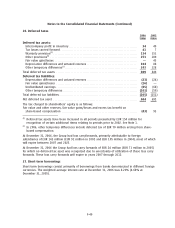
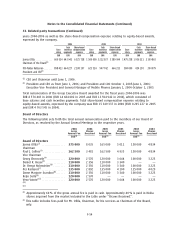
Nokia calculates the fair value of options using the Black Scholes model. The fair value of the stock
options is estimated at the grant date using the following assumptions:
2006 2005 2004
Weighted average expected dividend yield******* 2.08% 2.50% 2.44%
Weighted average expected volatility************ 24.09% 25.92% 33.00%
Riskfree interest rate ************************* 2.86% 3.75% 2.16% 3.09% 2.24% 4.22%
Weighted average riskfree interest rate ********* 3.62% 2.60% 3.07%
Expected life (years)*************************** 3.60 3.59 3.20
Weighted average share price ****************** 17.84 13.20 11.84
Expected term of stock options is estimated by observing general option holder behaviour and actual
historical terms of Nokia stock option plans.
Expected volatility has been set by reference to the implied volatility of options available on Nokia
shares in the open market and in light of historical patterns of volatility.
Performance shares
The Group has granted performance shares under the Global Plans 2004, 2005 and 2006, which have
been approved by the Board of Directors. A valid authorization from the Annual General Meeting is
required, when the plans are settled using the Nokia’s newly issued shares or transfer of existing
treasury shares. The Group may also settle the plans using Nokia shares purchased on the open
market or instead of shares cash settlement. The Group introduced performance shares in 2004 as
the main element to its broadbased equity compensation program, to further emphasize the
performance element in employees’ longterm incentives. The performance shares represent a
commitment by the Company to deliver Nokia shares to employees at a future point in time, subject
to the Group’s fulfillment of predefined performance criteria. No performance shares will vest unless
the Group’s performance reaches the threshold level of at least one of the two independent, pre
defined performance criteria. For performance between the threshold and maximum performance
levels the settlement follows a linear scale. Performance exceeding the maximum criteria does not
increase the number of shares vesting. The maximum number of performance shares (Maximum
Number) equals four times the number of performance shares originally granted (Threshold Number).
The criteria are calculated based on the Group’s Average Annual Net Sales Growth target for the
performance period of the plan and basic Earnings per Share (‘‘EPS’’) target at the end of the
performance period. For the 2004 plan the performance period consists of the fiscal years 2004
through 2007 and for the 2005 plan the years 2005 through 2008 and for the 2006 plan the years
2006 through 2008. In 2004 and 2005 plans, separate EPS threshold and maximum levels have been
determined for interim measurement period and the final performance period.
For both the 2004 and 2005 plans, if either of the required performance levels is achieved, the first
settlement will take place after the two year interim measurement period and is limited to a
maximum vesting equal to the Threshold Number. The second and final settlement, if any, will be
after the close of the four year performance period. Any settlement made after the Interim
Measurement Period, will be deducted from the final settlement after the full Performance Period.
The 2006 plan has a performance period of three years with no interim measurement period. No
performance shares will vest unless the Group’s performance reaches the threshold level of at least
one of the two independent, predefined performance criteria.
Until the Nokia shares are transferred and delivered, the recipients will not have any shareholder
rights, such as voting or dividend rights associated with the performance shares.
F45