Nokia 2006 Annual Report Download - page 165
Download and view the complete annual report
Please find page 165 of the 2006 Nokia annual report below. You can navigate through the pages in the report by either clicking on the pages listed below, or by using the keyword search tool below to find specific information within the annual report.-
 1
1 -
2
-
3
-
4
-
5
-
6
-
7
-
8
-
9
-
10
-
11
-
12
-
13
-
14
-
15
-
16
-
17
-
18
-
19
-
20
-
21
-
22
-
23
-
24
-
25
-
26
-
27
-
28
-
29
-
30
-
31
-
32
-
33
-
34
-
35
-
36
-
37
-
38
-
39
-
40
-
41
-
42
-
43
-
44
-
45
-
46
-
47
-
48
-
49
-
50
-
51
-
52
-
53
-
54
-
55
-
56
-
57
-
58
-
59
-
60
-
61
-
62
-
63
-
64
-
65
-
66
-
67
-
68
-
69
-
70
-
71
-
72
-
73
-
74
-
75
-
76
-
77
-
78
-
79
-
80
-
81
-
82
-
83
-
84
-
85
-
86
-
87
-
88
-
89
-
90
-
91
-
92
-
93
-
94
-
95
-
96
-
97
-
98
-
99
-
100
-
101
-
102
-
103
-
104
-
105
-
106
-
107
-
108
-
109
-
110
-
111
-
112
-
113
-
114
-
115
-
116
-
117
-
118
-
119
-
120
-
121
-
122
-
123
-
124
-
125
-
126
-
127
-
128
-
129
-
130
-
131
-
132
-
133
-
134
-
135
-
136
-
137
-
138
-
139
-
140
-
141
-
142
-
143
-
144
-
145
-
146
-
147
-
148
-
149
-
150
-
151
-
152
-
153
-
154
-
 155
155 -
 156
156 -
 157
157 -
 158
158 -
 159
159 -
 160
160 -
 161
161 -
 162
162 -
 163
163 -
 164
164 -
 165
165 -
 166
166 -
 167
167 -
 168
168 -
 169
169 -
 170
170 -
 171
171 -
 172
172 -
 173
173 -
 174
174 -
 175
175 -
176
-
177
-
178
-
179
-
180
-
181
-
182
-
183
-
184
-
185
-
186
-
187
-
188
-
189
-
190
-
191
-
192
-
193
-
194
-
195
-
196
-
197
-
198
-
199
-
200
-
201
-
202
-
203
-
204
-
205
-
206
-
207
-
208
-
209
-
210
-
211
-
212
-
213
-
214
-
215
-
216
 |
 |

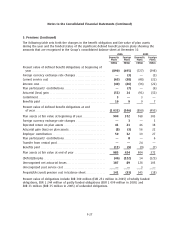
Notes to the Consolidated Financial Statements (Continued)
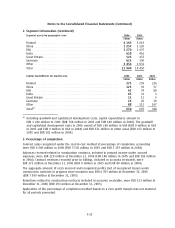
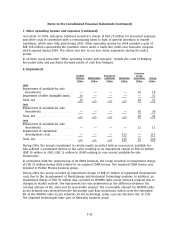
7. Other operating income and expenses (Continued)
real estate. In 2005, Enterprise Solutions recorded a charge of EUR 29 million for personnel expenses
and other costs in connection with a restructuring taken in light of general downturn in market
conditions, which were fully paid during 2005. Other operating income for 2004 includes a gain of
EUR 160 million representing the premium return under a multiline, multiyear insurance program,
which expired during 2004. The return was due to our low claims experience during the policy
period.
In all three years presented ‘‘Other operating income and expenses’’ include the costs of hedging
forecasted sales and purchases (forward points of cash flow hedges).
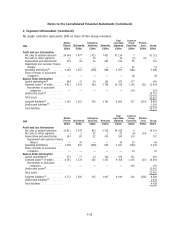
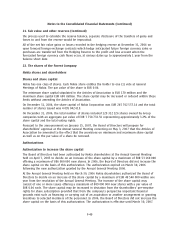
8. Impairment
Common
Mobile Enterprise Group
Phones Multimedia Solutions Networks Functions Group
EURm EURm EURm EURm EURm EURm
2006
Impairment of availableforsale
investments ********************* — — — — 18 18
Impairment of other intangible assets** 33 — — — — 33
Total, net ************************* 33 — — — 18 51
2005
Impairment of availableforsale
investments ********************* — — — — 30 30
Total, net ************************* — — — — 30 30
2004
Impairment of availableforsale
investments ********************* — — — — 11 11
Impairment of capitalized
development costs *************** — — — 115 — 115
Total, net ************************* — — — 115 11 126
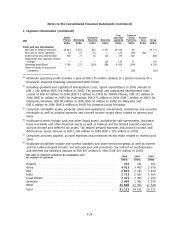
During 2006, the Group’s investment in certain equity securities held as noncurrent availablefor
sale suffered a permanent decline in fair value resulting in an impairment charge of EUR 18 million
(EUR 30 million in 2005, EUR 11 million in 2004) relating to noncurrent availableforsale
investments.
In connection with the restructuring of its CDMA business, the Group recorded an impairment charge
of EUR 33 million during 2006 related to an acquired CDMA license. The impaired CDMA license was
included in Mobile Phones business group.
During 2004, the Group recorded an impairment charge of EUR 65 million of capitalized development
costs due to the abandonment of FlexiGateway and Horizontal Technology modules. In addition, an
impairment charge of EUR 50 million was recorded on WCDMA radio access network program due to
changes in market outlook. The impairment loss was determined as the difference between the
carrying amount of the asset and its recoverable amount. The recoverable amount for WCDMA radio
access network was derived from the discounted cash flow projections, which cover the estimated
life of the WCDMA radio access network current technology, using a pretax discount rate of 15%.
The impaired technologies were part of Networks business group.
F30