Nokia 2006 Annual Report Download - page 45
Download and view the complete annual report
Please find page 45 of the 2006 Nokia annual report below. You can navigate through the pages in the report by either clicking on the pages listed below, or by using the keyword search tool below to find specific information within the annual report.-
 1
1 -
2
-
3
-
4
-
5
-
6
-
7
-
8
-
9
-
10
-
11
-
12
-
13
-
14
-
15
-
16
-
17
-
18
-
19
-
20
-
21
-
22
-
23
-
24
-
25
-
26
-
27
-
28
-
29
-
30
-
31
-
32
-
33
-
34
-
 35
35 -
 36
36 -
 37
37 -
 38
38 -
 39
39 -
 40
40 -
 41
41 -
 42
42 -
 43
43 -
 44
44 -
 45
45 -
 46
46 -
 47
47 -
 48
48 -
 49
49 -
 50
50 -
 51
51 -
 52
52 -
 53
53 -
 54
54 -
 55
55 -
56
-
57
-
58
-
59
-
60
-
61
-
62
-
63
-
64
-
65
-
66
-
67
-
68
-
69
-
70
-
71
-
72
-
73
-
74
-
75
-
76
-
77
-
78
-
79
-
80
-
81
-
82
-
83
-
84
-
85
-
86
-
87
-
88
-
89
-
90
-
91
-
92
-
93
-
94
-
95
-
96
-
97
-
98
-
99
-
100
-
101
-
102
-
103
-
104
-
105
-
106
-
107
-
108
-
109
-
110
-
111
-
112
-
113
-
114
-
115
-
116
-
117
-
118
-
119
-
120
-
121
-
122
-
123
-
124
-
125
-
126
-
127
-
128
-
129
-
130
-
131
-
132
-
133
-
134
-
135
-
136
-
137
-
138
-
139
-
140
-
141
-
142
-
143
-
144
-
145
-
146
-
147
-
148
-
149
-
150
-
151
-
152
-
153
-
154
-
155
-
156
-
157
-
158
-
159
-
160
-
161
-
162
-
163
-
164
-
165
-
166
-
167
-
168
-
169
-
170
-
171
-
172
-
173
-
174
-
175
-
176
-
177
-
178
-
179
-
180
-
181
-
182
-
183
-
184
-
185
-
186
-
187
-
188
-
189
-
190
-
191
-
192
-
193
-
194
-
195
-
196
-
197
-
198
-
199
-
200
-
201
-
202
-
203
-
204
-
205
-
206
-
207
-
208
-
209
-
210
-
211
-
212
-
213
-
214
-
215
-
216
 |
 |

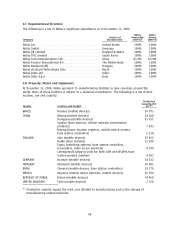
4.C Organizational Structure
The following is a list of Nokia’s significant subsidiaries as of December 31, 2006.
Nokia Nokia
Country of Ownership Voting
Company Incorporation Interest Interest
Nokia Inc. ****************************************** United States 100% 100%
Nokia GmbH***************************************** Germany 100% 100%
Nokia UK Limited ************************************ England & Wales 100% 100%
Nokia TMC Limited *********************************** South Korea 100% 100%
Nokia Telecommunications Ltd. ************************ China 83.9% 83.9%
Nokia Finance International B.V. *********************** The Netherlands 100% 100%
Nokia Kom´arom Kft ********************************** Hungary 100% 100%
Nokia do Brazil Technologia Ltda ********************** Brazil 100% 100%
Nokia India Ltd ************************************** India 100% 100%
Nokia Italia S.p.A************************************* Italy 100% 100%
4.D Property, Plants and Equipment
At December 31, 2006, Nokia operated 15 manufacturing facilities in nine countries around the
world. None of these facilities is subject to a material encumbrance. The following is a list of their
location, use and capacity.
Productive
Capacity, Net
Country Location and Product (m2)(1)
BRAZIL Manaus (mobile devices) 10 973
CHINA Beijing (mobile devices) 24 108
Dongguan (mobile devices) 33 357
Suzhou (base stations, cellular network transmission
products) 7 243
Beijing (home location registers, mobile switch centers,
base station controllers) 2 118
FINLAND Salo (mobile devices) 29 833
Rusko (base stations) 13 288
Espoo (switching systems, base station controllers,
transcoders, radio access products) 9 744
Limingantulli (plugin units for both GSM and WCDMA base
station product families) 4 587
GERMANY Bochum (mobile devices) 34 332
HUNGARY Kom´arom (mobile devices) 30 985
INDIA Chennai (mobile devices, base station controllers) 23 770
MEXICO Reynosa (mobile device batteries, mobile devices) 23 784
REPUBLIC OF KOREA Masan (mobile devices) 34 468
UNITED KINGDOM Fleet (mobile devices) 2 728
(1) Productive capacity equals the total area allotted to manufacturing and to the storage of
manufacturingrelated materials.
44