Nokia 2006 Annual Report Download - page 54
Download and view the complete annual report
Please find page 54 of the 2006 Nokia annual report below. You can navigate through the pages in the report by either clicking on the pages listed below, or by using the keyword search tool below to find specific information within the annual report.-
 1
1 -
2
-
3
-
4
-
5
-
6
-
7
-
8
-
9
-
10
-
11
-
12
-
13
-
14
-
15
-
16
-
17
-
18
-
19
-
20
-
21
-
22
-
23
-
24
-
25
-
26
-
27
-
28
-
29
-
30
-
31
-
32
-
33
-
34
-
35
-
36
-
37
-
38
-
39
-
40
-
41
-
42
-
43
-
 44
44 -
 45
45 -
 46
46 -
 47
47 -
 48
48 -
 49
49 -
 50
50 -
 51
51 -
 52
52 -
 53
53 -
 54
54 -
 55
55 -
 56
56 -
 57
57 -
 58
58 -
 59
59 -
 60
60 -
 61
61 -
 62
62 -
 63
63 -
 64
64 -
65
-
66
-
67
-
68
-
69
-
70
-
71
-
72
-
73
-
74
-
75
-
76
-
77
-
78
-
79
-
80
-
81
-
82
-
83
-
84
-
85
-
86
-
87
-
88
-
89
-
90
-
91
-
92
-
93
-
94
-
95
-
96
-
97
-
98
-
99
-
100
-
101
-
102
-
103
-
104
-
105
-
106
-
107
-
108
-
109
-
110
-
111
-
112
-
113
-
114
-
115
-
116
-
117
-
118
-
119
-
120
-
121
-
122
-
123
-
124
-
125
-
126
-
127
-
128
-
129
-
130
-
131
-
132
-
133
-
134
-
135
-
136
-
137
-
138
-
139
-
140
-
141
-
142
-
143
-
144
-
145
-
146
-
147
-
148
-
149
-
150
-
151
-
152
-
153
-
154
-
155
-
156
-
157
-
158
-
159
-
160
-
161
-
162
-
163
-
164
-
165
-
166
-
167
-
168
-
169
-
170
-
171
-
172
-
173
-
174
-
175
-
176
-
177
-
178
-
179
-
180
-
181
-
182
-
183
-
184
-
185
-
186
-
187
-
188
-
189
-
190
-
191
-
192
-
193
-
194
-
195
-
196
-
197
-
198
-
199
-
200
-
201
-
202
-
203
-
204
-
205
-
206
-
207
-
208
-
209
-
210
-
211
-
212
-
213
-
214
-
215
-
216
 |
 |
between Nokia and Siemens on the results and consequences of a Siemens compliance review, and
the agreement of a number of detailed implementation steps.
The Group is in the process of evaluating the net assets acquired and expects to finalize the
purchase price allocation and to realize a gain on this transaction during 2007.
See ’’Item 4 Business Overview—Nokia Siemens Networks’’ for more information on Nokia Siemens
Networks.
Certain Other Factors
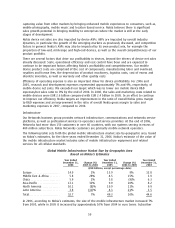
United States Dollar
In 2006, the US dollar depreciated against the euro by 11.4% (when measured yearend rate
compared to the yearend rate for the previous year). When measured by the average rate used to
record transactions in foreign currency for accounting purposes for the year compared with the
corresponding rate for the previous year, the US dollar appreciated against the euro by 0.7% in
2006. The stronger US dollar on average had a slight positive impact on our net sales expressed in
euros because approximately 50% of our net sales are generated in US dollars and currencies closely
following the US dollar. However, the average appreciation of the US dollar also contributed to a
higher average product cost as approximately 50% of the components we use are sourced in US
dollars. To mitigate the impact of changes in exchange rates on net sales as well as average product
cost, we hedge all material transaction exposures on a gross basis. All in all, the average
appreciation of the US dollar had a slightly positive impact on our operating profit in 2006. For more
information, see ‘‘—Results of Operations—Exchange Rates’’ below.
Finnish Corporate Tax Rate
Effective January 1, 2005, the Finnish corporate tax rate was reduced by 3 percentage points from
29% to 26%. This reduction had a significant favorable impact on Nokia’s net profit in 2005 as more
than half of Nokia’s profit before tax has been generated in Finland. See also Note 12 to our
consolidated financial statements for a further discussion of our income taxes.
Seasonality
Our device sales are somewhat affected by seasonality. Historically, the first quarter of the year was
the lowest quarter of the year, while the fourth quarter was the strongest quarter. This was mainly
due to the effect of holiday sales. The second quarter of the year was another high season, as
consumers in the Northern Hemisphere prepared for summer vacations. The third quarter was
usually slower than the second and fourth quarters, as consumers postponed purchases until the
yearend holiday season.
However, we have seen a trend towards less seasonality. We still continue to see the fourth quarter
as our strongest quarter, while the differences between the three other quarters have begun to
moderate. This trend has resulted, first, from the fact that the purchasing behavior of firsttime
mobile device buyers tends to be more seasonal than that of people who are replacing their device
for a new model. Because replacement sales comprise an increasing percentage of sales, the
seasonality of mobile device sales has decreased. The trend towards less seasonality has also been
aided by an increase of our geographical sales reach. The times at which people give gifts vary
across the world, and as our global sales coverage increases, this softens the seasonality of sales.
However, as we still continue to see our strongest sales in the fourth quarter, we believe that they
are still supported by the yearend and holiday seasonality.
Our infrastructure business has also experienced some seasonality during the last few years. Sales
have been higher in the last quarter of the year compared with the first quarter of the following
year, due to operators’ planning, budgeting and spending cycle.
53