Nokia 2006 Annual Report Download - page 48
Download and view the complete annual report
Please find page 48 of the 2006 Nokia annual report below. You can navigate through the pages in the report by either clicking on the pages listed below, or by using the keyword search tool below to find specific information within the annual report.-
 1
1 -
2
-
3
-
4
-
5
-
6
-
7
-
8
-
9
-
10
-
11
-
12
-
13
-
14
-
15
-
16
-
17
-
18
-
19
-
20
-
21
-
22
-
23
-
24
-
25
-
26
-
27
-
28
-
29
-
30
-
31
-
32
-
33
-
34
-
35
-
36
-
37
-
 38
38 -
 39
39 -
 40
40 -
 41
41 -
 42
42 -
 43
43 -
 44
44 -
 45
45 -
 46
46 -
 47
47 -
 48
48 -
 49
49 -
 50
50 -
 51
51 -
 52
52 -
 53
53 -
 54
54 -
 55
55 -
 56
56 -
 57
57 -
 58
58 -
59
-
60
-
61
-
62
-
63
-
64
-
65
-
66
-
67
-
68
-
69
-
70
-
71
-
72
-
73
-
74
-
75
-
76
-
77
-
78
-
79
-
80
-
81
-
82
-
83
-
84
-
85
-
86
-
87
-
88
-
89
-
90
-
91
-
92
-
93
-
94
-
95
-
96
-
97
-
98
-
99
-
100
-
101
-
102
-
103
-
104
-
105
-
106
-
107
-
108
-
109
-
110
-
111
-
112
-
113
-
114
-
115
-
116
-
117
-
118
-
119
-
120
-
121
-
122
-
123
-
124
-
125
-
126
-
127
-
128
-
129
-
130
-
131
-
132
-
133
-
134
-
135
-
136
-
137
-
138
-
139
-
140
-
141
-
142
-
143
-
144
-
145
-
146
-
147
-
148
-
149
-
150
-
151
-
152
-
153
-
154
-
155
-
156
-
157
-
158
-
159
-
160
-
161
-
162
-
163
-
164
-
165
-
166
-
167
-
168
-
169
-
170
-
171
-
172
-
173
-
174
-
175
-
176
-
177
-
178
-
179
-
180
-
181
-
182
-
183
-
184
-
185
-
186
-
187
-
188
-
189
-
190
-
191
-
192
-
193
-
194
-
195
-
196
-
197
-
198
-
199
-
200
-
201
-
202
-
203
-
204
-
205
-
206
-
207
-
208
-
209
-
210
-
211
-
212
-
213
-
214
-
215
-
216
 |
 |

Principal Factors Affecting our Results of Operations
Mobile Devices
Our mobile device sales are derived from the sale of mobile devices by our Mobile Phones and
Multimedia business groups and by the Mobile Devices business unit of our Enterprise Solutions
business group. Our principal customers are mobile network operators, distributors, independent
retailers, corporate customers and consumers. Our product portfolio covers all major user segments
and price points from entrylevel to midrange and highend devices offering voice, data, multimedia
and business applications.
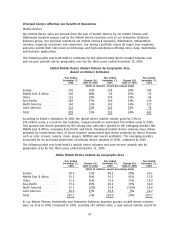
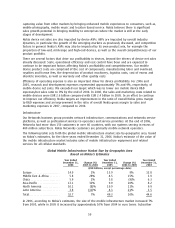
The following table sets forth Nokia’s estimates for the global mobile device market volumes and
yearonyear growth rate by geographic area for the three years ended December 31, 2006.
Global Mobile Device Market Volume by Geographic Area
Based on Nokia’s Estimates
Year Ended Year Ended Year Ended
December 31, Change (%) December 31, Change (%) December 31,
2006 2005 to 2006 2005 2004 to 2005 2004
(Units in millions, except percentage data)
Europe ******************* 276 16% 238 20% 198
Middle East & Africa ******* 106 68% 63 62% 39
China ******************** 129 29% 100 19% 84
AsiaPacific *************** 189 27% 149 18% 126
North America ************ 160 13% 142 16% 122
Latin America ************* 118 15% 103 39% 74
Total********************* 978 23% 795 24% 643
According to Nokia’s estimates, in 2006 the global device market volume grew by 23% to
978 million units, a record for the industry, compared with an estimated 795 million units in 2005.
This growth was driven primarily by the strong new subscriber growth in the emerging markets like
Middle East & Africa, emerging AsiaPacific and China. Developed market device volumes were driven
primarily by replacement sales. In those markets replacement was driven primarily by device features
such as color screens, camera, music players, WCDMA and overall aesthetics. The emerging markets
accounted for an increased proportion of industry device volumes in 2006, compared to 2005.
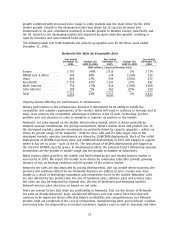
The following table sets forth Nokia’s mobile device volumes and yearonyear growth rate by
geographic area for the three years ended December 31, 2006.
Nokia Mobile Device Volume by Geographic Area
Year Ended Year Ended Year Ended
December 31, Change (%) December 31, Change (%) December 31,
2006 2005 to 2006 2005 2004 to 2005 2004
(Units in millions, except percentage data)
Europe ******************* 99.6 13% 88.5 28% 69.2
Middle East & Africa ******* 53.2 36% 39.2 41% 27.8
China ******************** 51.0 56% 32.6 72% 18.9
AsiaPacific *************** 79.8 65% 48.4 39% 34.8
North America ************ 25.3 (2)% 25.8 (10)% 28.8
Latin America ************* 38.6 27% 30.4 8% 28.2
Total********************* 347.5 31% 264.9 28% 207.7
In our Mobile Phones, Multimedia and Enterprise Solutions business groups, mobile device volumes
were up 31% in 2006 compared to 2005, reaching 347 million units, a new annual volume record for
47