Nokia 2006 Annual Report Download - page 61
Download and view the complete annual report
Please find page 61 of the 2006 Nokia annual report below. You can navigate through the pages in the report by either clicking on the pages listed below, or by using the keyword search tool below to find specific information within the annual report.-
 1
1 -
2
-
3
-
4
-
5
-
6
-
7
-
8
-
9
-
10
-
11
-
12
-
13
-
14
-
15
-
16
-
17
-
18
-
19
-
20
-
21
-
22
-
23
-
24
-
25
-
26
-
27
-
28
-
29
-
30
-
31
-
32
-
33
-
34
-
35
-
36
-
37
-
38
-
39
-
40
-
41
-
42
-
43
-
44
-
45
-
46
-
47
-
48
-
49
-
50
-
 51
51 -
 52
52 -
 53
53 -
 54
54 -
 55
55 -
 56
56 -
 57
57 -
 58
58 -
 59
59 -
 60
60 -
 61
61 -
 62
62 -
 63
63 -
 64
64 -
 65
65 -
 66
66 -
 67
67 -
 68
68 -
 69
69 -
 70
70 -
 71
71 -
72
-
73
-
74
-
75
-
76
-
77
-
78
-
79
-
80
-
81
-
82
-
83
-
84
-
85
-
86
-
87
-
88
-
89
-
90
-
91
-
92
-
93
-
94
-
95
-
96
-
97
-
98
-
99
-
100
-
101
-
102
-
103
-
104
-
105
-
106
-
107
-
108
-
109
-
110
-
111
-
112
-
113
-
114
-
115
-
116
-
117
-
118
-
119
-
120
-
121
-
122
-
123
-
124
-
125
-
126
-
127
-
128
-
129
-
130
-
131
-
132
-
133
-
134
-
135
-
136
-
137
-
138
-
139
-
140
-
141
-
142
-
143
-
144
-
145
-
146
-
147
-
148
-
149
-
150
-
151
-
152
-
153
-
154
-
155
-
156
-
157
-
158
-
159
-
160
-
161
-
162
-
163
-
164
-
165
-
166
-
167
-
168
-
169
-
170
-
171
-
172
-
173
-
174
-
175
-
176
-
177
-
178
-
179
-
180
-
181
-
182
-
183
-
184
-
185
-
186
-
187
-
188
-
189
-
190
-
191
-
192
-
193
-
194
-
195
-
196
-
197
-
198
-
199
-
200
-
201
-
202
-
203
-
204
-
205
-
206
-
207
-
208
-
209
-
210
-
211
-
212
-
213
-
214
-
215
-
216
 |
 |
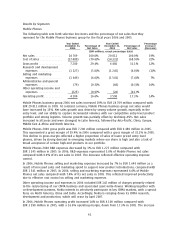
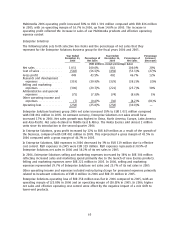
Research and development, or R&D, expenses were EUR 3.9 billion in 2006, up 2% from
EUR 3.8 billion in 2005. R&D expenses represented 9.5% of net sales in 2006, down from 11.2% in
2005. The decrease in R&D as a percentage of net sales reflected our continued effort to improve the
efficiency of our investments. R&D expenses increased in Multimedia and Networks and decreased in
Mobile Phones and Enterprise Solutions. In 2005, Multimedia incurred a restructuring charge of
EUR 15 million related to R&D activities. If this item were excluded, R&D expenses would have
increased 2% in 2006 and would have represented 9.5% of Nokia net sales in 2006 compared with
11.1% of Nokia net sales in 2005.
In 2006, selling and marketing expenses were EUR 3.3 billion, up 12% from EUR 3.0 billion in 2005,
reflecting increased sales and marketing spend in all business groups to support new product
introductions. Selling and marketing expenses represented 8.1% of Nokia net sales in 2006, down
from 8.7% in 2005.
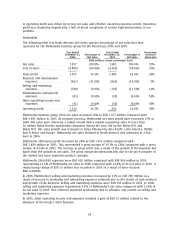
Administrative and general expenses were EUR 0.7 billion in 2006 and EUR 0.6 million in 2005.
Administrative and general expenses were equal to 1.6% of net sales in 2006 compared to 1.8% in
2005.
In 2006, other operating expenses included EUR 142 million of charges primarily related to the
restructuring of the CDMA business and associated asset writedowns. Other operating expenses
included also restructuring charge of EUR 8 million for personnel expenses primarily related to
headcount reductions in Enterprise Solutions in 2006. In 2006, other operating income included a
gain of EUR 276 million representing our share of the proceeds from the Telsim sale. In 2005, other
operating income and expenses included a gain of EUR 61 million relating to the divesture of the
Group’s Tetra business, a gain of EUR 18 million related to the partial sale of a minority investment,
and a gain of EUR 45 million related to qualifying sales and leaseback transactions for real estate. In
2005, Enterprise Solutions recorded a charge of EUR 29 million for personnel expenses and other
costs in connection with the restructuring taken in light of a general downturn in market conditions.
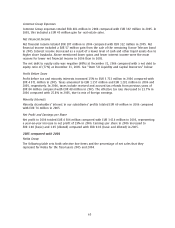
Nokia Group’s operating profit for 2006 increased 18% to EUR 5 488 million compared with
EUR 4 639 million in 2005. An increase in Mobile Phones’ and Multimedia’s operating profit in 2006
more than offset an unchanged operating loss in Enterprise Solutions and an operating profit decline
in Networks. Networks operating profit included the negative impact of EUR 39 million incremental
costs related to Nokia Siemens Networks. Our operating margin was 13.3% in 2006 compared with
13.6% in 2005.
60