Nokia 2006 Annual Report Download - page 172
Download and view the complete annual report
Please find page 172 of the 2006 Nokia annual report below. You can navigate through the pages in the report by either clicking on the pages listed below, or by using the keyword search tool below to find specific information within the annual report.-
 1
1 -
2
-
3
-
4
-
5
-
6
-
7
-
8
-
9
-
10
-
11
-
12
-
13
-
14
-
15
-
16
-
17
-
18
-
19
-
20
-
21
-
22
-
23
-
24
-
25
-
26
-
27
-
28
-
29
-
30
-
31
-
32
-
33
-
34
-
35
-
36
-
37
-
38
-
39
-
40
-
41
-
42
-
43
-
44
-
45
-
46
-
47
-
48
-
49
-
50
-
51
-
52
-
53
-
54
-
55
-
56
-
57
-
58
-
59
-
60
-
61
-
62
-
63
-
64
-
65
-
66
-
67
-
68
-
69
-
70
-
71
-
72
-
73
-
74
-
75
-
76
-
77
-
78
-
79
-
80
-
81
-
82
-
83
-
84
-
85
-
86
-
87
-
88
-
89
-
90
-
91
-
92
-
93
-
94
-
95
-
96
-
97
-
98
-
99
-
100
-
101
-
102
-
103
-
104
-
105
-
106
-
107
-
108
-
109
-
110
-
111
-
112
-
113
-
114
-
115
-
116
-
117
-
118
-
119
-
120
-
121
-
122
-
123
-
124
-
125
-
126
-
127
-
128
-
129
-
130
-
131
-
132
-
133
-
134
-
135
-
136
-
137
-
138
-
139
-
140
-
141
-
142
-
143
-
144
-
145
-
146
-
147
-
148
-
149
-
150
-
151
-
152
-
153
-
154
-
155
-
156
-
157
-
158
-
159
-
160
-
161
-
 162
162 -
 163
163 -
 164
164 -
 165
165 -
 166
166 -
 167
167 -
 168
168 -
 169
169 -
 170
170 -
 171
171 -
 172
172 -
 173
173 -
 174
174 -
 175
175 -
 176
176 -
 177
177 -
 178
178 -
 179
179 -
 180
180 -
 181
181 -
 182
182 -
183
-
184
-
185
-
186
-
187
-
188
-
189
-
190
-
191
-
192
-
193
-
194
-
195
-
196
-
197
-
198
-
199
-
200
-
201
-
202
-
203
-
204
-
205
-
206
-
207
-
208
-
209
-
210
-
211
-
212
-
213
-
214
-
215
-
216
 |
 |

Notes to the Consolidated Financial Statements (Continued)
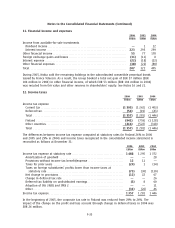
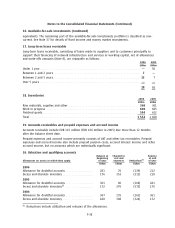
15. Investments in associated companies
2006 2005
EURm EURm
Net carrying amount January 1************************************************** 193 200
Translation differences ********************************************************* (2) 8
Additions ********************************************************************* 19 12
Disposals ********************************************************************* (1) (17)
Share of results *************************************************************** 28 10
Other movements ************************************************************* (13) (20)
Net carrying amount December 31 ********************************************** 224 193
In 2005, the Group disposed of part of its 36.2% minority holding in Aircom Ltd resulting in a
holding of 10%. The gain on the sale recorded in other operating income was EUR 18 million. The
Group’s remaining 10% holding in Aircom shares is recorded as a noncurrent availableforsale
investment.
Shareholdings in associated companies are comprised of investments in unlisted companies in all
periods presented.
16. Availableforsale investments
2006 2005
EURm EURm
Fair value at January 1****************************************************** 8 591 10 876
Translation differences ****************************************************** (44) 49
Deductions, net ************************************************************ (1 184) (2 276)
Fair value gains (losses)***************************************************** 1(28)
Impairment charges (Note 8) ************************************************ (18) (30)
Fair value at December 31 ************************************************** 7 346 8 591
Noncurrent *************************************************************** 288 246
Current, liquid assets ******************************************************* 5 012 6 852
Current, cash equivalents *************************************************** 2 046 1 493
Availableforsale investments, comprising marketable debt and equity securities and investments in
unlisted equity shares, are fair valued, except in the case of certain unlisted equities, where the fair
value cannot be measured reliably. Such unlisted equities are carried at cost, less impairment
(EUR 103 million in 2006 and EUR 82 million in 2005). Fair value for equity investments traded in
active markets and for unlisted equities, where the fair value can be measured reliably, was
EUR 185 million in 2006 and EUR 165 million in 2005. Fair value for equity investments traded in
active markets is determined by using exchange quoted bid prices. For other investments, fair value
is estimated by using the current market value of similar instruments or by reference to the
discounted cash flows of the underlying net assets. Gains and losses arising from the change in the
fair value of availableforsale investments are recognized directly in Fair value and other reserves.
Availableforsale investments comprise: (1) highly liquid, interestbearing investments with
maturities at acquisition of longer than 3 months, which are regarded as current availableforsale
investments, liquid assets, (2) similar types of investments as in category (1), but with maturities at
acquisition of less than 3 months, which are regarded as current availableforsale investments, cash
F37