Nokia 2006 Annual Report Download - page 186
Download and view the complete annual report
Please find page 186 of the 2006 Nokia annual report below. You can navigate through the pages in the report by either clicking on the pages listed below, or by using the keyword search tool below to find specific information within the annual report.-
 1
1 -
2
-
3
-
4
-
5
-
6
-
7
-
8
-
9
-
10
-
11
-
12
-
13
-
14
-
15
-
16
-
17
-
18
-
19
-
20
-
21
-
22
-
23
-
24
-
25
-
26
-
27
-
28
-
29
-
30
-
31
-
32
-
33
-
34
-
35
-
36
-
37
-
38
-
39
-
40
-
41
-
42
-
43
-
44
-
45
-
46
-
47
-
48
-
49
-
50
-
51
-
52
-
53
-
54
-
55
-
56
-
57
-
58
-
59
-
60
-
61
-
62
-
63
-
64
-
65
-
66
-
67
-
68
-
69
-
70
-
71
-
72
-
73
-
74
-
75
-
76
-
77
-
78
-
79
-
80
-
81
-
82
-
83
-
84
-
85
-
86
-
87
-
88
-
89
-
90
-
91
-
92
-
93
-
94
-
95
-
96
-
97
-
98
-
99
-
100
-
101
-
102
-
103
-
104
-
105
-
106
-
107
-
108
-
109
-
110
-
111
-
112
-
113
-
114
-
115
-
116
-
117
-
118
-
119
-
120
-
121
-
122
-
123
-
124
-
125
-
126
-
127
-
128
-
129
-
130
-
131
-
132
-
133
-
134
-
135
-
136
-
137
-
138
-
139
-
140
-
141
-
142
-
143
-
144
-
145
-
146
-
147
-
148
-
149
-
150
-
151
-
152
-
153
-
154
-
155
-
156
-
157
-
158
-
159
-
160
-
161
-
162
-
163
-
164
-
165
-
166
-
167
-
168
-
169
-
170
-
171
-
172
-
173
-
174
-
175
-
 176
176 -
 177
177 -
 178
178 -
 179
179 -
 180
180 -
 181
181 -
 182
182 -
 183
183 -
 184
184 -
 185
185 -
 186
186 -
 187
187 -
 188
188 -
 189
189 -
 190
190 -
 191
191 -
 192
192 -
 193
193 -
 194
194 -
 195
195 -
 196
196 -
197
-
198
-
199
-
200
-
201
-
202
-
203
-
204
-
205
-
206
-
207
-
208
-
209
-
210
-
211
-
212
-
213
-
214
-
215
-
216
 |
 |

Notes to the Consolidated Financial Statements (Continued)
30. Earnings per share
2005 2004
2006 As revised As revised
Numerator (EURm)
Basic/Diluted:
Profit attributable to equity holders of the parent ******** 4 306 3 616 3 192
Denominator (000’s Shares)
Basic:
Weighted average shares ****************************** 4 062 833 4 365 547 4 593 196
Effect of dilutive securities:
stock options, restricted shares and performance shares 23 696 5 692 7 141
Diluted:
Adjusted weighted average shares and assumed
conversions **************************************** 4 086 529 4 371 239 4 600 337
Under IAS 33, basic earnings per share is computed using the weighted average number of shares
outstanding during the period. Diluted earnings per share is computed using the weighted average
number of shares outstanding during the period plus the dilutive effect of stock options, restricted
shares and performance shares outstanding during the period.
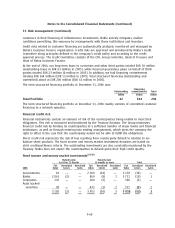
31. Commitments and contingencies
2006 2005
EURm EURm
Collateral for our own commitments
Property under mortgages ****************************************************** 18 18
Assets pledged **************************************************************** 27 10
Contingent liabilities on behalf of Group companies
Other guarantees ************************************************************** 358 276
Collateral given on behalf of other companies
Securities pledged(1)************************************************************ ——
Contingent liabilities on behalf of other companies
Financial guarantees on behalf of third parties(1) ********************************** 23 —
Other guarantees ************************************************************** 22
Financing commitments
Customer finance commitments(1)************************************************ 164 13
Venture fund commitments(2) *************************************************** 208 230
(1) See also note 37 b).
(2) See also note 37 a).
The amounts above represent the maximum principal amount of commitments and contingencies.
Property under mortgages given as collateral for our own commitments include mortgages given to
the Finnish National Board of Customs as a general indemnity of EUR 18 million in 2006 (EUR
18 million in 2005).
Assets pledged for the Group’s own commitments include availableforsale investments of
EUR 10 million in 2006 (EUR 10 million of availableforsale investments in 2005).
Other guarantees include guarantees of Nokia’s performance of EUR 316 million in 2006
(EUR 234 million in 2005). EUR 259 million (EUR 182 million in 2005) of these guarantees are
provided to certain Networks’ customers in the form of bank guarantees, standby letters of credit
F51