Nokia 2006 Annual Report Download - page 181
Download and view the complete annual report
Please find page 181 of the 2006 Nokia annual report below. You can navigate through the pages in the report by either clicking on the pages listed below, or by using the keyword search tool below to find specific information within the annual report.-
 1
1 -
2
-
3
-
4
-
5
-
6
-
7
-
8
-
9
-
10
-
11
-
12
-
13
-
14
-
15
-
16
-
17
-
18
-
19
-
20
-
21
-
22
-
23
-
24
-
25
-
26
-
27
-
28
-
29
-
30
-
31
-
32
-
33
-
34
-
35
-
36
-
37
-
38
-
39
-
40
-
41
-
42
-
43
-
44
-
45
-
46
-
47
-
48
-
49
-
50
-
51
-
52
-
53
-
54
-
55
-
56
-
57
-
58
-
59
-
60
-
61
-
62
-
63
-
64
-
65
-
66
-
67
-
68
-
69
-
70
-
71
-
72
-
73
-
74
-
75
-
76
-
77
-
78
-
79
-
80
-
81
-
82
-
83
-
84
-
85
-
86
-
87
-
88
-
89
-
90
-
91
-
92
-
93
-
94
-
95
-
96
-
97
-
98
-
99
-
100
-
101
-
102
-
103
-
104
-
105
-
106
-
107
-
108
-
109
-
110
-
111
-
112
-
113
-
114
-
115
-
116
-
117
-
118
-
119
-
120
-
121
-
122
-
123
-
124
-
125
-
126
-
127
-
128
-
129
-
130
-
131
-
132
-
133
-
134
-
135
-
136
-
137
-
138
-
139
-
140
-
141
-
142
-
143
-
144
-
145
-
146
-
147
-
148
-
149
-
150
-
151
-
152
-
153
-
154
-
155
-
156
-
157
-
158
-
159
-
160
-
161
-
162
-
163
-
164
-
165
-
166
-
167
-
168
-
169
-
170
-
 171
171 -
 172
172 -
 173
173 -
 174
174 -
 175
175 -
 176
176 -
 177
177 -
 178
178 -
 179
179 -
 180
180 -
 181
181 -
 182
182 -
 183
183 -
 184
184 -
 185
185 -
 186
186 -
 187
187 -
 188
188 -
 189
189 -
 190
190 -
 191
191 -
192
-
193
-
194
-
195
-
196
-
197
-
198
-
199
-
200
-
201
-
202
-
203
-
204
-
205
-
206
-
207
-
208
-
209
-
210
-
211
-
212
-
213
-
214
-
215
-
216
 |
 |

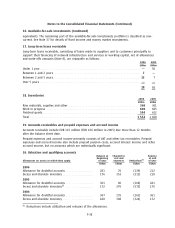
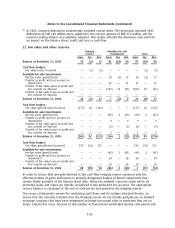
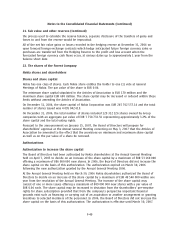
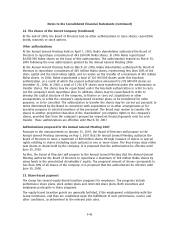
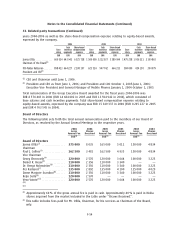
Notes to the Consolidated Financial Statements (Continued)
23. Sharebased payment (Continued)
The following table summarizes our 2004, 2005 and 2006 global performance share plans:
Performance Number of Interim
shares participants measurement Performance 1st (interim) 2nd (final)
Plan outstanding (approx.) period period settlement settlement
2004*************** 3 449 502 11 000 20042005 20042007 2006 2008
2005*************** 4 107 301 12 000 20052006 20052008 2007 2009
2006*************** 4 755 186 13 000 N/A 20062008 N/A 2009
The following table sets forth the performance criteria of each global performance share plan, as
well as the potential number of performance shares vesting if performance criteria are met:
Threshold Performance Maximum Performance
Average Annual Average Annual
Plan EPS(1) Net Sales Growth(1) EPS(1) Net Sales Growth(1)
2004 Interim measurement 0.80 4% 0.94 16%
Performance period 0.84 4% 1.18 16%
Number of shares 1.72 million 1.72 million 6.90 million 6.90 million
vesting
(2)
2005 Interim measurement 0.75 3% 0.96 12%
Performance period 0.82 3% 1.33 12%
Number of shares 2.05 million 2.05 million 8.21 million 8.21 million
vesting
(2)
2006 Performance period 0.96 5% 1.41 20%
Number of shares 2.38 million 2.38 million 9.51 million 9.51 million
vesting
(2)
(1) Both the EPS and Average Annual Net Sales Growth criteria have an equal weight of 50%.
(2) A performance share represents the grant at threshold. At maximum performance, the settlement
amounts to four times the number of performance shares originally granted at threshold.
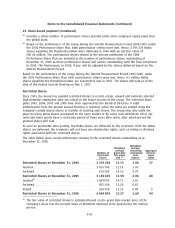
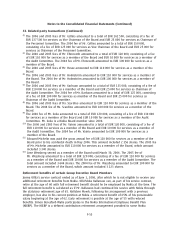
The table below sets forth certain information relating to the performance shares outstanding at
December 31, 2006:
Weighted
Number of average Weighted average Aggregate
performance grant date remaining intrinsic
shares at fair value contractual value
threshold EUR (1) term (years) EURm(2)
Performance shares at January 1, 2005****** 3 910 840 10.58 3.25 91
Granted ************************************ 4 469 219 11.86 3.74
Forfeited *********************************** 337 242 10.74 3.88
Performance shares at December 31, 2005 ** 8 042 817 11.28 2.79 344
Granted(3)*********************************** 5 140 736 14.83 2.48
Forfeited *********************************** 569 164 12.30 1.34
Performance shares at December 31, 2006(4) ** 12 614 389 12.93 1.91 557
(1) The fair value of performance shares is estimated based on the grant date market price of the
Company’s share less the present value of dividends expected to be paid during the vesting
period.
(2) The aggregate intrinsic value reflects management’s estimate of the number of shares expected
to vest.
F46