Nokia 2006 Annual Report Download - page 102
Download and view the complete annual report
Please find page 102 of the 2006 Nokia annual report below. You can navigate through the pages in the report by either clicking on the pages listed below, or by using the keyword search tool below to find specific information within the annual report.-
 1
1 -
2
-
3
-
4
-
5
-
6
-
7
-
8
-
9
-
10
-
11
-
12
-
13
-
14
-
15
-
16
-
17
-
18
-
19
-
20
-
21
-
22
-
23
-
24
-
25
-
26
-
27
-
28
-
29
-
30
-
31
-
32
-
33
-
34
-
35
-
36
-
37
-
38
-
39
-
40
-
41
-
42
-
43
-
44
-
45
-
46
-
47
-
48
-
49
-
50
-
51
-
52
-
53
-
54
-
55
-
56
-
57
-
58
-
59
-
60
-
61
-
62
-
63
-
64
-
65
-
66
-
67
-
68
-
69
-
70
-
71
-
72
-
73
-
74
-
75
-
76
-
77
-
78
-
79
-
80
-
81
-
82
-
83
-
84
-
85
-
86
-
87
-
88
-
89
-
90
-
91
-
 92
92 -
 93
93 -
 94
94 -
 95
95 -
 96
96 -
 97
97 -
 98
98 -
 99
99 -
 100
100 -
 101
101 -
 102
102 -
 103
103 -
 104
104 -
 105
105 -
 106
106 -
 107
107 -
 108
108 -
 109
109 -
 110
110 -
 111
111 -
 112
112 -
113
-
114
-
115
-
116
-
117
-
118
-
119
-
120
-
121
-
122
-
123
-
124
-
125
-
126
-
127
-
128
-
129
-
130
-
131
-
132
-
133
-
134
-
135
-
136
-
137
-
138
-
139
-
140
-
141
-
142
-
143
-
144
-
145
-
146
-
147
-
148
-
149
-
150
-
151
-
152
-
153
-
154
-
155
-
156
-
157
-
158
-
159
-
160
-
161
-
162
-
163
-
164
-
165
-
166
-
167
-
168
-
169
-
170
-
171
-
172
-
173
-
174
-
175
-
176
-
177
-
178
-
179
-
180
-
181
-
182
-
183
-
184
-
185
-
186
-
187
-
188
-
189
-
190
-
191
-
192
-
193
-
194
-
195
-
196
-
197
-
198
-
199
-
200
-
201
-
202
-
203
-
204
-
205
-
206
-
207
-
208
-
209
-
210
-
211
-
212
-
213
-
214
-
215
-
216
 |
 |

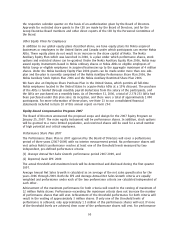
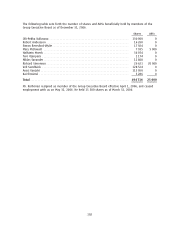
The following table sets forth the number of shares and ADSs beneficially held by members of the
Board of Directors as of December 31, 2006.
Shares(1) ADSs
Jorma Ollila(2)*********************************************************** 286 468 0
Paul J. Collins*********************************************************** 0 122 626
Georg Ehrnrooth(3) ****************************************************** 314 996 0
Daniel R. Hesse ********************************************************* 0 5 696
Bengt Holmstr¨om ******************************************************* 16 606 0
Per Karlsson(3) ********************************************************** 19 538 0
Marjorie Scardino ******************************************************* 0 14 018
Keijo Suila ************************************************************* 2 570 0
Vesa Vainio ************************************************************ 27 784 0
Total ****************************************************************** 667 962 142 340
(1) The number of shares includes not only shares acquired as compensation for services rendered as
a member of the Board of Directors, but also shares acquired by any other means.
(2) For Mr. Ollila, this table includes his share ownership only. Mr. Ollila was the company’s CEO until
June 1, 2006 and received stock options, performance shares and restricted shares in that capacity
until the said date. Mr. Ollila’s holdings of longterm equitybased incentives are outlined in
footnote 5 under ‘‘Stock Option Ownership of the Group Executive Board’’ on page 105 and, in
footnote 6 under ‘‘Performance Shares and Restricted Shares’’ on page 107.
(3) Mr. Ehrnrooth’s and Mr. Karlsson’s holdings include both shares held personally and shares held
through a company.
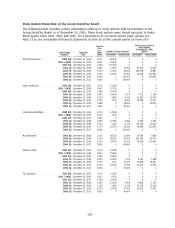
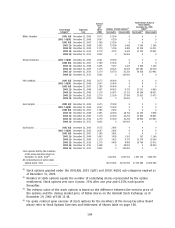
Share Ownership of the Group Executive Board
The following table sets forth the share ownership, as well as potential ownership interest through
holding of equity based incentives, of the members of the Group Executive Board as of December 31,
2006.
Shares Receivable
Shares Through
Receivable Performance Shares Receivable
Through Stock Shares at Through Restricted
Shares Options Threshold(3) Shares
Number of Equity Instruments Held by
Group Executive Board *************** 519 716 2 755 806 477 360 884 500
% of the Share Capital(1) **************** 0.013 0.069 0.012 0.022
% of the Total Outstanding Equity
Incentives (per Instrument)(2)********** — 3.007 3.784 14.584
(1) The percentage is calculated in relation to the outstanding share capital and total voting rights of
the company, excluding shares held by the Group.
(2) The percentage is calculated in relation to the total outstanding equity incentives per instrument,
i.e. stock options, performance shares and restricted shares, as applicable.
(3) Performance shares at threshold represent the original grant. At maximum performance, the
settlement amounts to four times the number of performance shares originally granted (at
threshold). Due to the interim payout in 2006, the maximum number of Nokia shares deliverable
under the performance share plan 2004 equals three times the number of performance shares
originally granted (at threshold).
101