Nokia 2006 Annual Report Download - page 196
Download and view the complete annual report
Please find page 196 of the 2006 Nokia annual report below. You can navigate through the pages in the report by either clicking on the pages listed below, or by using the keyword search tool below to find specific information within the annual report.-
 1
1 -
2
-
3
-
4
-
5
-
6
-
7
-
8
-
9
-
10
-
11
-
12
-
13
-
14
-
15
-
16
-
17
-
18
-
19
-
20
-
21
-
22
-
23
-
24
-
25
-
26
-
27
-
28
-
29
-
30
-
31
-
32
-
33
-
34
-
35
-
36
-
37
-
38
-
39
-
40
-
41
-
42
-
43
-
44
-
45
-
46
-
47
-
48
-
49
-
50
-
51
-
52
-
53
-
54
-
55
-
56
-
57
-
58
-
59
-
60
-
61
-
62
-
63
-
64
-
65
-
66
-
67
-
68
-
69
-
70
-
71
-
72
-
73
-
74
-
75
-
76
-
77
-
78
-
79
-
80
-
81
-
82
-
83
-
84
-
85
-
86
-
87
-
88
-
89
-
90
-
91
-
92
-
93
-
94
-
95
-
96
-
97
-
98
-
99
-
100
-
101
-
102
-
103
-
104
-
105
-
106
-
107
-
108
-
109
-
110
-
111
-
112
-
113
-
114
-
115
-
116
-
117
-
118
-
119
-
120
-
121
-
122
-
123
-
124
-
125
-
126
-
127
-
128
-
129
-
130
-
131
-
132
-
133
-
134
-
135
-
136
-
137
-
138
-
139
-
140
-
141
-
142
-
143
-
144
-
145
-
146
-
147
-
148
-
149
-
150
-
151
-
152
-
153
-
154
-
155
-
156
-
157
-
158
-
159
-
160
-
161
-
162
-
163
-
164
-
165
-
166
-
167
-
168
-
169
-
170
-
171
-
172
-
173
-
174
-
175
-
176
-
177
-
178
-
179
-
180
-
181
-
182
-
183
-
184
-
185
-
 186
186 -
 187
187 -
 188
188 -
 189
189 -
 190
190 -
 191
191 -
 192
192 -
 193
193 -
 194
194 -
 195
195 -
 196
196 -
 197
197 -
 198
198 -
 199
199 -
 200
200 -
 201
201 -
 202
202 -
 203
203 -
 204
204 -
 205
205 -
 206
206 -
207
-
208
-
209
-
210
-
211
-
212
-
213
-
214
-
215
-
216
 |
 |

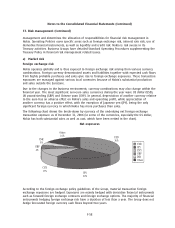
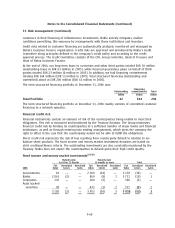
Notes to the Consolidated Financial Statements (Continued)
37. Risk management (Continued)
Maturity date Maturity date
less than 12 Months 12 months or more Total
Fair Unrealized Unrealized Fair Unrealized Unrealized Fair Unrealized Unrealized
2005 Value Losses Gains Value Losses Gains Value Losses Gains
Governments ******* 30 — — 3 919 (32) 2 3 949 (32) 2
Banks ************* 2 962 (3) — 803 (5) 1 3 765 (7) 1
Corporates ********* 60 — — 433 (1) 2 459 (1) 2
Asset backed
securities ******** 25 — — 112 — — 172 — —
3 077 (3) — 5 267 (38) 5 8 345 (41) 5
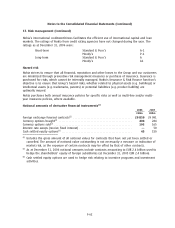
2006 2005
EURm EURm
Fixed rate investments ******************************************************** 5 853 7 531
Floating rate investments ***************************************************** 1 205 814
Total************************************************************************ 7 058 8 345
(1) Fixed income and moneymarket investments include Term deposits, investments in Liquidity
funds and investments in fixed income instruments classified as Availableforsale. Availablefor
sale investments are carried at fair value in 2006 and 2005.
(2) Weighted average interest rate for fixed income and moneymarket investments was 3.33% in
2006 and 3.52% in 2005.
(3) Included within fixed income and moneymarket investments is EUR 10 million of restricted cash
at December 31, 2006 (10 million at December 31, 2005)
c) Liquidity risk
Nokia guarantees a sufficient liquidity at all times by efficient cash management and by investing in
liquid interest bearing securities. Due to the dynamic nature of the underlying business Treasury also
aims at maintaining flexibility in funding by keeping committed and uncommitted credit lines
available. At the end of December 31, 2006 the committed facility totaled USD 2.0 billion. The
committed credit facility is intended to be used for US and Euro Commercial Paper Programs back up
purposes. The commitment fee on the facility is 0.045% per annum.
The most significant existing funding programs include:
Revolving Credit Facility of USD 2 000 million, maturing in 2012
Local commercial paper program in Finland, totaling EUR 750 million
Euro Commercial Paper (ECP) program, totaling USD 500 million
US Commercial Paper (USCP) program, totaling USD 500 million
None of the above programs have been used to a significant degree in 2006.
F61