Nokia 2006 Annual Report Download - page 73
Download and view the complete annual report
Please find page 73 of the 2006 Nokia annual report below. You can navigate through the pages in the report by either clicking on the pages listed below, or by using the keyword search tool below to find specific information within the annual report.-
 1
1 -
2
-
3
-
4
-
5
-
6
-
7
-
8
-
9
-
10
-
11
-
12
-
13
-
14
-
15
-
16
-
17
-
18
-
19
-
20
-
21
-
22
-
23
-
24
-
25
-
26
-
27
-
28
-
29
-
30
-
31
-
32
-
33
-
34
-
35
-
36
-
37
-
38
-
39
-
40
-
41
-
42
-
43
-
44
-
45
-
46
-
47
-
48
-
49
-
50
-
51
-
52
-
53
-
54
-
55
-
56
-
57
-
58
-
59
-
60
-
61
-
62
-
 63
63 -
 64
64 -
 65
65 -
 66
66 -
 67
67 -
 68
68 -
 69
69 -
 70
70 -
 71
71 -
 72
72 -
 73
73 -
 74
74 -
 75
75 -
 76
76 -
 77
77 -
 78
78 -
 79
79 -
 80
80 -
 81
81 -
 82
82 -
 83
83 -
84
-
85
-
86
-
87
-
88
-
89
-
90
-
91
-
92
-
93
-
94
-
95
-
96
-
97
-
98
-
99
-
100
-
101
-
102
-
103
-
104
-
105
-
106
-
107
-
108
-
109
-
110
-
111
-
112
-
113
-
114
-
115
-
116
-
117
-
118
-
119
-
120
-
121
-
122
-
123
-
124
-
125
-
126
-
127
-
128
-
129
-
130
-
131
-
132
-
133
-
134
-
135
-
136
-
137
-
138
-
139
-
140
-
141
-
142
-
143
-
144
-
145
-
146
-
147
-
148
-
149
-
150
-
151
-
152
-
153
-
154
-
155
-
156
-
157
-
158
-
159
-
160
-
161
-
162
-
163
-
164
-
165
-
166
-
167
-
168
-
169
-
170
-
171
-
172
-
173
-
174
-
175
-
176
-
177
-
178
-
179
-
180
-
181
-
182
-
183
-
184
-
185
-
186
-
187
-
188
-
189
-
190
-
191
-
192
-
193
-
194
-
195
-
196
-
197
-
198
-
199
-
200
-
201
-
202
-
203
-
204
-
205
-
206
-
207
-
208
-
209
-
210
-
211
-
212
-
213
-
214
-
215
-
216
 |
 |
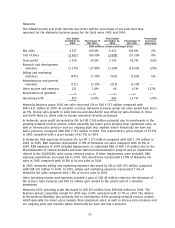
and sale commitments, give rise to foreign exchange exposure. In general, depreciation of another
currency relative to the euro has an adverse effect on Nokia’s sales and operating profit, while
appreciation of another currency relative to the euro has a positive effect, with the exception of
Japanese yen, being the only significant foreign currency in which Nokia has more purchases than
sales.
During 2006, the US dollar appreciated by approximately 0.7% against the euro (measured by the
average rate used to record transactions in foreign currency for accounting purposes for the year
compared to average rate for the previous year). During 2005 and 2004, the US dollar depreciated by
approximately 1.7% and 10.7%, respectively. The change in value of the US dollar had a slight
positive impact on Nokia’s operating profit in 2006 and a slight negative impact in 2005 and
material negative impact in 2004. During 2006, the Chinese yuan appreciated by approximately 3.3%
against the euro. During 2005 and 2004, the Chinese yuan depreciated by approximately 0.8% and
10.7%, respectively. The change in value of the Chinese yuan had a slight positive impact on Nokia’s
operating profit in 2006 and a negative impact in 2005 and 2004. During 2006 and 2004, the UK
pound sterling appreciated by approximately 0.3% and 1.2% against the euro, respectively. During
2005, the UK pound depreciated by approximately 0.5%. The change in value of the UK pound
sterling had a slightly positive impact on Nokia’s net sales expressed in euros as well as operating
profit in 2006 and 2004 and a slight negative impact in 2005. During 2006, 2005 and 2004, the
Japanese yen depreciated by approximately 6.0%, 1.6% and 3.0%, respectively against the euro. The
change in value of the Japanese yen had a slight positive impact on Nokia’s operating profit in each
year. To mitigate the impact of changes in exchange rates on net sales, average product cost as well
as operating profit, Nokia hedges all material transaction exposures on a gross basis.
Nokia’s balance sheet is also affected by the translation into euro for financial reporting purposes of
the shareholders’ equity of our foreign subsidiaries that are denominated in currencies other than
the euro. In general, this translation increases our shareholders’ equity when the euro depreciates,
and affects shareholders’ equity adversely when the euro appreciates against the relevant other
currencies (yearend rate to previous yearend rate).
For a discussion on the instruments used by Nokia in connection with our hedging activities, see
Note 37 to our consolidated financial statements included in Item 18 of this Form 20F. See also
‘‘Item 11. Quantitative and Qualitative Disclosures About Market Risk’’ and ‘‘Item 3.D Risk Factors—
Our sales, costs and results are affected by exchange rate fluctuations, particularly between the euro,
which is our reporting currency, and the US dollar, the Chinese yuan, the UK pound sterling and the
Japanese yen as well as certain other currencies.’’
Principal Differences Between IFRS and US GAAP
Nokia’s consolidated financial statements are prepared in accordance with IFRS.
Our net profit in 2006 under IFRS was EUR 4 306 million compared with EUR 3 616 million in 2005
and EUR 3 192 million in 2004. Under US GAAP, Nokia would have reported net income of EUR 4 275
million in 2006 compared with EUR 3 582 million in 2005 and EUR 3 343 million in 2004.
The principal differences between IFRS and US GAAP that affect our net profit or loss, as well as our
shareholders’ equity, relate to the treatment of capitalization and impairment of development costs,
pensions, sharebased compensation expense, identifiable intangible assets acquired, amortization
and impairment of goodwill, translation of goodwill and cash flow hedges. See Note 38 to our
consolidated financial statements included in Item 18 of this annual report on Form 20F for a
description of the principal differences between IFRS and US GAAP and for a description of the
anticipated impact on the consolidated financial statements of the adoption of recently issued US
GAAP accounting standards.
72