Nokia 2006 Annual Report Download - page 71
Download and view the complete annual report
Please find page 71 of the 2006 Nokia annual report below. You can navigate through the pages in the report by either clicking on the pages listed below, or by using the keyword search tool below to find specific information within the annual report.-
 1
1 -
2
-
3
-
4
-
5
-
6
-
7
-
8
-
9
-
10
-
11
-
12
-
13
-
14
-
15
-
16
-
17
-
18
-
19
-
20
-
21
-
22
-
23
-
24
-
25
-
26
-
27
-
28
-
29
-
30
-
31
-
32
-
33
-
34
-
35
-
36
-
37
-
38
-
39
-
40
-
41
-
42
-
43
-
44
-
45
-
46
-
47
-
48
-
49
-
50
-
51
-
52
-
53
-
54
-
55
-
56
-
57
-
58
-
59
-
60
-
 61
61 -
 62
62 -
 63
63 -
 64
64 -
 65
65 -
 66
66 -
 67
67 -
 68
68 -
 69
69 -
 70
70 -
 71
71 -
 72
72 -
 73
73 -
 74
74 -
 75
75 -
 76
76 -
 77
77 -
 78
78 -
 79
79 -
 80
80 -
 81
81 -
82
-
83
-
84
-
85
-
86
-
87
-
88
-
89
-
90
-
91
-
92
-
93
-
94
-
95
-
96
-
97
-
98
-
99
-
100
-
101
-
102
-
103
-
104
-
105
-
106
-
107
-
108
-
109
-
110
-
111
-
112
-
113
-
114
-
115
-
116
-
117
-
118
-
119
-
120
-
121
-
122
-
123
-
124
-
125
-
126
-
127
-
128
-
129
-
130
-
131
-
132
-
133
-
134
-
135
-
136
-
137
-
138
-
139
-
140
-
141
-
142
-
143
-
144
-
145
-
146
-
147
-
148
-
149
-
150
-
151
-
152
-
153
-
154
-
155
-
156
-
157
-
158
-
159
-
160
-
161
-
162
-
163
-
164
-
165
-
166
-
167
-
168
-
169
-
170
-
171
-
172
-
173
-
174
-
175
-
176
-
177
-
178
-
179
-
180
-
181
-
182
-
183
-
184
-
185
-
186
-
187
-
188
-
189
-
190
-
191
-
192
-
193
-
194
-
195
-
196
-
197
-
198
-
199
-
200
-
201
-
202
-
203
-
204
-
205
-
206
-
207
-
208
-
209
-
210
-
211
-
212
-
213
-
214
-
215
-
216
 |
 |

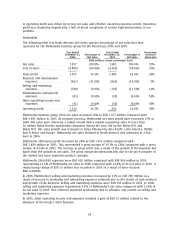
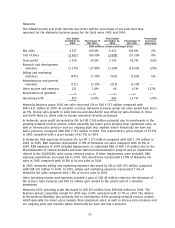
Networks
The following table sets forth selective line items and the percentage of net sales that they
represent for the Networks business group for the fiscal years 2005 and 2004.
Year Ended Year Ended Percentage
December 31, Percentage of December 31, Percentage of Increase/
2005 Net Sales 2004 Net Sales (Decrease)
(EUR millions, except percentage data)
Net sales ****************** 6 557 100.0% 6 431 100.0% 2%
Cost of Sales *************** (3 967) (60.5)% (3 688) (57.3)% 8%
Gross profit **************** 2 590 39.5% 2 743 42.7% (6)%
Research and development
expenses **************** (1 170) (17.8)% (1 194) (18.6)% (2)%
Selling and marketing
expenses **************** (475) (7.3)% (503) (7.8)% 6%
Administrative and general
expenses **************** (211) (3.2)% (210) (3.3)% —
Other income and expenses** 121 1.8% 48 0.7% 152%
Amortization of goodwill **** —— ———
Operating profit ************ 855 13.0% 884 13.7% (3)%
Networks business group 2005 net sales increased 2% to EUR 6 557 million compared with
EUR 6 431 million in 2004. At constant currency, Networks business group net sales would have been
up 6%. Strong sales growth in Latin America and AsiaPacific was offset by sales declines in China
and North America, while sales in Europe remained virtually unchanged.
In Networks, gross profit decreased by 6% to EUR 2 590 million primarily due to investments in the
growing network services market, which generally has lower gross margins than equipment sales, as
well as intense price pressure and our ongoing push into markets where historically we have not
had a presence, compared with EUR 2 743 million in 2004. This represented a gross margin of 39.5%
in 2005 compared with a gross margin of 42.7% in 2004.
In Networks, R&D expenses decreased 2% to EUR 1 170 million compared with EUR 1 194 million in
2004. In 2005, R&D expenses represented 17.8% of Networks net sales compared with 18.6% in
2004. R&D expenses in 2004 included impairments of capitalized R&D of EUR 115 million due to the
discontinuation of certain products and base station horizontalization projects and an impairment
related to the 3G/WCDMA radio access network project. If these impairments were excluded, R&D
expenses would have increased 8% in 2005. This would have represented 17.8% of Networks net
sales in 2005 compared with 16.8% of its net sales in 2004.
In 2005, Networks selling and marketing expenses decreased by 6% to EUR 475 million compared
with EUR 503 million in 2004. In 2005, selling and marketing expenses represented 7.3% of
Networks net sales compared with 7.8% of its net sales in 2004.
Other operating income and expenses included a gain of EUR 42 million related to the divesture of
the Group’s Tetra business and EUR 18 million gain related to the partial sale of a minority
investment.
Networks 2005 operating profit decreased to EUR 855 million from EUR 884 million in 2004. The
business group’s operating margin for 2005 was 13.0% compared with 13.7% in 2004. The decline
in Networks profitability was primarily due to investments in the growing network services market,
which generally has lower gross margins than equipment sales, as well as intense price pressure and
our ongoing push into markets where historically we have not had a presence.
70