Neiman Marcus 2014 Annual Report Download - page 74
Download and view the complete annual report
Please find page 74 of the 2014 Neiman Marcus annual report below. You can navigate through the pages in the report by either clicking on the pages listed below, or by using the keyword search tool below to find specific information within the annual report.-
 1
1 -
2
-
3
-
4
-
5
-
6
-
7
-
8
-
9
-
10
-
11
-
12
-
13
-
14
-
15
-
16
-
17
-
18
-
19
-
20
-
21
-
22
-
23
-
24
-
25
-
26
-
27
-
28
-
29
-
30
-
31
-
32
-
33
-
34
-
35
-
36
-
37
-
38
-
39
-
40
-
41
-
42
-
43
-
44
-
45
-
46
-
47
-
48
-
49
-
50
-
51
-
52
-
53
-
54
-
55
-
56
-
57
-
58
-
59
-
60
-
61
-
62
-
63
-
 64
64 -
 65
65 -
 66
66 -
 67
67 -
 68
68 -
 69
69 -
 70
70 -
 71
71 -
 72
72 -
 73
73 -
 74
74 -
 75
75 -
 76
76 -
 77
77 -
 78
78 -
 79
79 -
 80
80 -
 81
81 -
 82
82 -
 83
83 -
 84
84 -
85
-
86
-
87
-
88
-
89
-
90
-
91
-
92
-
93
-
94
-
95
-
96
-
97
-
98
-
99
-
100
-
101
-
102
-
103
-
104
-
105
-
106
-
107
-
108
-
109
-
110
-
111
-
112
-
113
-
114
-
115
-
116
-
117
-
118
-
119
-
120
-
121
-
122
-
123
-
124
-
125
-
126
-
127
-
128
-
129
-
130
-
131
-
132
-
133
-
134
-
135
-
136
-
137
-
138
-
139
-
140
-
141
-
142
-
143
-
144
-
145
-
146
-
147
-
148
-
149
-
150
-
151
-
152
-
153
-
154
-
155
-
156
-
157
-
158
-
159
-
160
-
161
 |
 |

Table of Contents
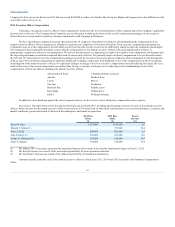
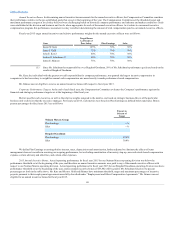
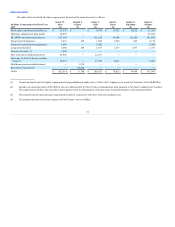
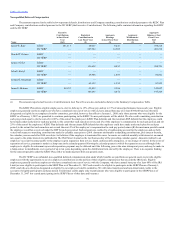
The following table sets forth the annual compensation for the named executive officers.
President and
Chief Executive
Officer
2015
1,100,000
—
—
—
247,294
425,914
1,773,208
2014
1,070,000
—
20,452,674
958,988
798,000
3,325,621
26,605,283
2013
1,070,000
—
1,379,327
799,667
5,944
719,068
3,974,006
Executive Vice
President, Chief
Operating Officer and
Chief Financial
Officer
2015
97,596
300,000
3,825,580
—
—
31,786
4,254,962
President, Chief
Merchandising
Officer
2015
820,000
—
—
—
45,000
200,057
1,065,057
2014
800,000
100,000
6,574,044
411,600
156,000
2,890,940
10,932,584
2013
770,000
—
808,571
227,415
—
233,135
2,039,121
President, Neiman
Marcus Stores and
Online
2015
625,000
—
—
—
—
78,425
703,425
2014
550,000
100,000
3,652,700
213,510
—
624,542
5,140,752
2013
512,000
54,992
523,193
320,008
—
29,261
1,439,454
President of Bergdorf
Goodman and
President of NMG
International
2015
610,000
—
—
53,802
—
74,994
738,796
2014
510,000
100,000
3,652,700
216,036
—
275,445
4,754,181
2013
500,000
40,502
380,504
59,498
—
8,215
988,719
Vice Chairman
2015
750,000
—
—
—
41,104
197,069
988,173
2014
750,000
250,000
4,748,306
385,875
133,000
1,476,457
7,743,638
2013
720,000
—
618,319
358,094
2,021
256,828
1,955,262
(1) The amount for Mr. Grimes for fiscal year 2015 represents a one-time signing bonus pursuant to the terms and conditions of his employment
agreement. The amounts for Messrs. Gold, Koryl, Schulman and Skinner for fiscal year 2014 represent a transaction bonus awarded for their efforts in
the success of the Acquisition.
(2) The amounts reflect the aggregate grant date fair value for the awards computed in accordance with ASC Topic 718. Assumptions used in
calculating the fiscal year 2015 amounts are described under the caption Stock‑Based Awards in Note 14 of the Notes to Consolidated Financial
Statements. These amounts reflect the grant date fair value and do not represent the actual value that may be realized by the named executive
officers.
(3) The amounts reported in the Non‑Equity Incentive Plan Compensation column reflect the actual amounts earned under the performance‑based
annual cash incentive compensation plan described under “Annual Incentive Bonus.”
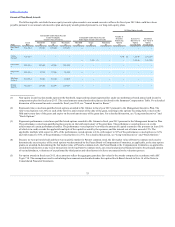
(4) The amounts in this column represent the change in the actuarial value of the named executive officers’ benefits under our retirement and
supplemental executive retirement plans from August 3, 2014 to August 1, 2015. This “change in the actuarial value” is the difference between the
fiscal year 2014 and fiscal year 2015 present value of the pension benefits accumulated as of year-end by the named executive officers, assuming
that the benefit is not paid until age 65. These amounts were computed using the same assumptions used for financial statement reporting purposes
under ASC Subtopic 715-30, “Defined Benefit Plans - Pension” as described in Note 11 of the Notes to Consolidated Financial Statements.
Also included in this column for Ms. Katz and Mr. Skinner are $294 and $104, respectively, of earnings in the Key Employee Deferred
Compensation Plan that were in excess of 120% of the federal long-term rate for the period August 1, 2014 to July 31, 2015.
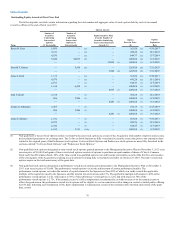
(5) Includes all items listed in the following table entitled “All Other Compensation.” The value of perquisites and other personal benefits is provided
in this column and in the footnotes below even if the amount is less than the reporting threshold established by the SEC.
73