Neiman Marcus 2014 Annual Report Download - page 145
Download and view the complete annual report
Please find page 145 of the 2014 Neiman Marcus annual report below. You can navigate through the pages in the report by either clicking on the pages listed below, or by using the keyword search tool below to find specific information within the annual report.-
 1
1 -
2
-
3
-
4
-
5
-
6
-
7
-
8
-
9
-
10
-
11
-
12
-
13
-
14
-
15
-
16
-
17
-
18
-
19
-
20
-
21
-
22
-
23
-
24
-
25
-
26
-
27
-
28
-
29
-
30
-
31
-
32
-
33
-
34
-
35
-
36
-
37
-
38
-
39
-
40
-
41
-
42
-
43
-
44
-
45
-
46
-
47
-
48
-
49
-
50
-
51
-
52
-
53
-
54
-
55
-
56
-
57
-
58
-
59
-
60
-
61
-
62
-
63
-
64
-
65
-
66
-
67
-
68
-
69
-
70
-
71
-
72
-
73
-
74
-
75
-
76
-
77
-
78
-
79
-
80
-
81
-
82
-
83
-
84
-
85
-
86
-
87
-
88
-
89
-
90
-
91
-
92
-
93
-
94
-
95
-
96
-
97
-
98
-
99
-
100
-
101
-
102
-
103
-
104
-
105
-
106
-
107
-
108
-
109
-
110
-
111
-
112
-
113
-
114
-
115
-
116
-
117
-
118
-
119
-
120
-
121
-
122
-
123
-
124
-
125
-
126
-
127
-
128
-
129
-
130
-
131
-
132
-
133
-
134
-
 135
135 -
 136
136 -
 137
137 -
 138
138 -
 139
139 -
 140
140 -
 141
141 -
 142
142 -
 143
143 -
 144
144 -
 145
145 -
 146
146 -
 147
147 -
 148
148 -
 149
149 -
 150
150 -
 151
151 -
 152
152 -
 153
153 -
 154
154 -
 155
155 -
156
-
157
-
158
-
159
-
160
-
161
 |
 |
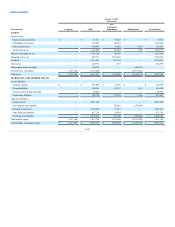
Table of Contents
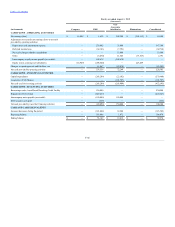
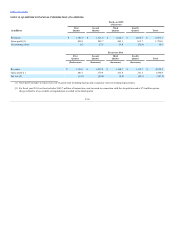
Current assets:
Cash and cash equivalents
$ —
$ 53,162
$ 19,812
$ —
$ 72,974
Merchandise inventories
—
970,295
184,549
—
1,154,844
Other current assets
—
138,966
18,082
(165)
156,883
Total current assets
—
1,162,423
222,443
(165)
1,384,701
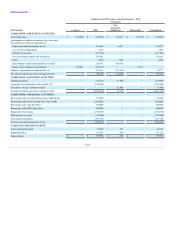
Property and equipment, net
—
1,359,118
118,768
—
1,477,886
Intangible assets, net
—
625,937
2,972,625
—
3,598,562
Goodwill
—
1,611,365
661,118
—
2,272,483
Other assets
—
140,776
1,354
—
142,130
Intercompany notes receivable
—
150,028
—
(150,028)
—
Investments in subsidiaries
1,413,744
3,617,680
—
(5,031,424)
—
Total assets
$ 1,413,744
$ 8,667,327
$ 3,976,308
$ (5,181,617)
$ 8,875,762
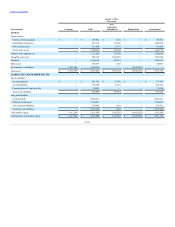
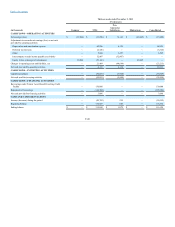
Current liabilities:
Accounts payable
$ —
$ 291,089
$ 51,910
$ —
$ 342,999
Accrued liabilities
—
380,255
85,312
(165)
465,402
Current portion of long-term debt
—
29,426
—
—
29,426
Total current liabilities
—
700,770
137,222
(165)
837,827
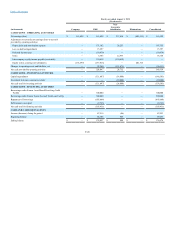
Long-term liabilities:
Long-term debt
—
4,681,309
—
—
4,681,309
Intercompany notes payable
—
—
150,028
(150,028)
—
Deferred income taxes
—
1,454,278
16,813
—
1,471,091
Other long-term liabilities
—
417,226
54,565
—
471,791
Total long-term liabilities
—
6,552,813
221,406
(150,028)
6,624,191
Total member equity
1,413,744
1,413,744
3,617,680
(5,031,424)
1,413,744
Total liabilities and member equity
$ 1,413,744
$ 8,667,327
$ 3,976,308
$ (5,181,617)
$ 8,875,762
F-42