Neiman Marcus 2014 Annual Report Download - page 156
Download and view the complete annual report
Please find page 156 of the 2014 Neiman Marcus annual report below. You can navigate through the pages in the report by either clicking on the pages listed below, or by using the keyword search tool below to find specific information within the annual report.-
 1
1 -
2
-
3
-
4
-
5
-
6
-
7
-
8
-
9
-
10
-
11
-
12
-
13
-
14
-
15
-
16
-
17
-
18
-
19
-
20
-
21
-
22
-
23
-
24
-
25
-
26
-
27
-
28
-
29
-
30
-
31
-
32
-
33
-
34
-
35
-
36
-
37
-
38
-
39
-
40
-
41
-
42
-
43
-
44
-
45
-
46
-
47
-
48
-
49
-
50
-
51
-
52
-
53
-
54
-
55
-
56
-
57
-
58
-
59
-
60
-
61
-
62
-
63
-
64
-
65
-
66
-
67
-
68
-
69
-
70
-
71
-
72
-
73
-
74
-
75
-
76
-
77
-
78
-
79
-
80
-
81
-
82
-
83
-
84
-
85
-
86
-
87
-
88
-
89
-
90
-
91
-
92
-
93
-
94
-
95
-
96
-
97
-
98
-
99
-
100
-
101
-
102
-
103
-
104
-
105
-
106
-
107
-
108
-
109
-
110
-
111
-
112
-
113
-
114
-
115
-
116
-
117
-
118
-
119
-
120
-
121
-
122
-
123
-
124
-
125
-
126
-
127
-
128
-
129
-
130
-
131
-
132
-
133
-
134
-
135
-
136
-
137
-
138
-
139
-
140
-
141
-
142
-
143
-
144
-
145
-
 146
146 -
 147
147 -
 148
148 -
 149
149 -
 150
150 -
 151
151 -
 152
152 -
 153
153 -
 154
154 -
 155
155 -
 156
156 -
 157
157 -
 158
158 -
 159
159 -
 160
160 -
 161
161
 |
 |

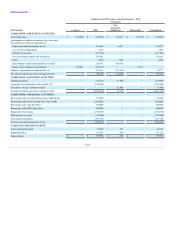
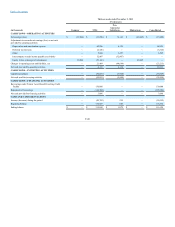
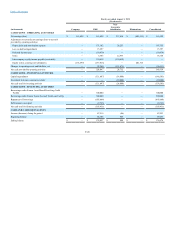
EXHIBIT 12.1
NEIMAN MARCUS GROUP LTD LLC
COMPUTATION OF RATIO OF EARNINGS TO FIXED CHARGES
(UNAUDITED)
Fiscal
year ended
Thirty-nine
weeks ended
Thirteen
weeks ended
Fiscal
year ended
Fiscal
year ended
Fiscal
year ended
(in thousands, except ratios)
August 1,
2015
August 2,
2014
November 2,
2013
August 3,
2013
July 28,
2012
July 30,
2011
(Successor)
(Successor)
(Predecessor)
(Predecessor)
(Predecessor)
(Predecessor)
Fixed charges:
Interest on debt
$ 267,752
$ 216,281
$ 34,998
$ 160,839
$ 167,916
$ 266,816
Amortization of debt discount and
expense
24,560
17,117
2,466
8,404
8,457
14,661
Interest element of rentals
33,462
23,232
7,293
29,139
27,687
26,301
Total fixed charges
$ 325,774
$ 256,630
$ 44,757
$ 198,382
$ 204,060
$ 307,778
Earnings (loss):
Earnings (loss) from continuing
operations before income taxes
$ 28,076
$ (223,908)
$ (5,179)
$ 277,432
$ 228,337
$ 49,264
Add back:
Fixed charges
325,774
256,630
44,757
198,382
204,060
307,778
Amortization of capitalized
interest
1,208
886
295
1,181
1,142
1,115
Less:
Capitalized interest
(2,361)
(630)
(140)
(237)
(1,080)
(535)
Total earnings
$ 352,697
$ 32,978
$ 39,733
$ 476,758
$ 432,459
$ 357,622
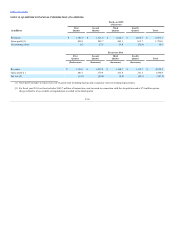
Ratio of earnings to fixed charges (a)
1.1
(b)
(c) 2.4
2.1
1.2
(a) Interest associated with income tax liabilities is excluded from our calculation.
(b) For the thirty-nine weeks ended August 2, 2014, the aggregate amount of fixed charges exceeded our earnings by approximately $223.7 million,
which is the amount of additional earnings that would have been required to achieve a ratio of earnings to fixed charges of 1.0x for such period.
(c) For the thirteen weeks ended November 2, 2013, the aggregate amount of fixed charges exceeded our earnings by approximately $5.0 million, which
is the amount of additional earnings that would have been required to achieve a ratio of earnings to fixed charges of 1.0x for such period.