Neiman Marcus 2014 Annual Report Download - page 137
Download and view the complete annual report
Please find page 137 of the 2014 Neiman Marcus annual report below. You can navigate through the pages in the report by either clicking on the pages listed below, or by using the keyword search tool below to find specific information within the annual report.-
 1
1 -
2
-
3
-
4
-
5
-
6
-
7
-
8
-
9
-
10
-
11
-
12
-
13
-
14
-
15
-
16
-
17
-
18
-
19
-
20
-
21
-
22
-
23
-
24
-
25
-
26
-
27
-
28
-
29
-
30
-
31
-
32
-
33
-
34
-
35
-
36
-
37
-
38
-
39
-
40
-
41
-
42
-
43
-
44
-
45
-
46
-
47
-
48
-
49
-
50
-
51
-
52
-
53
-
54
-
55
-
56
-
57
-
58
-
59
-
60
-
61
-
62
-
63
-
64
-
65
-
66
-
67
-
68
-
69
-
70
-
71
-
72
-
73
-
74
-
75
-
76
-
77
-
78
-
79
-
80
-
81
-
82
-
83
-
84
-
85
-
86
-
87
-
88
-
89
-
90
-
91
-
92
-
93
-
94
-
95
-
96
-
97
-
98
-
99
-
100
-
101
-
102
-
103
-
104
-
105
-
106
-
107
-
108
-
109
-
110
-
111
-
112
-
113
-
114
-
115
-
116
-
117
-
118
-
119
-
120
-
121
-
122
-
123
-
124
-
125
-
126
-
 127
127 -
 128
128 -
 129
129 -
 130
130 -
 131
131 -
 132
132 -
 133
133 -
 134
134 -
 135
135 -
 136
136 -
 137
137 -
 138
138 -
 139
139 -
 140
140 -
 141
141 -
 142
142 -
 143
143 -
 144
144 -
 145
145 -
 146
146 -
 147
147 -
148
-
149
-
150
-
151
-
152
-
153
-
154
-
155
-
156
-
157
-
158
-
159
-
160
-
161
 |
 |

Table of Contents
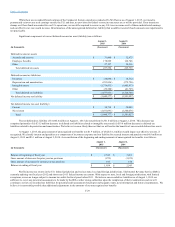
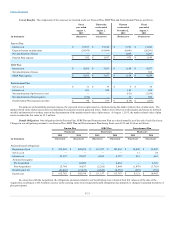
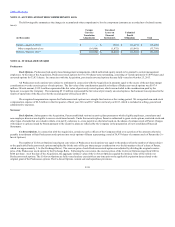
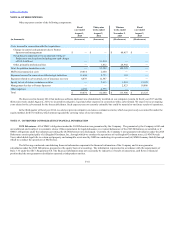
The table below sets forth a summary of changes in the fair value of our Pension Plan’s Level 3 investment assets for fiscal years 2015 and 2014.
Balance, beginning of year
$ 185,227
$ 181,148
Purchases
59,390
80,529
Sales
(63,492)
(89,668)
Realized gains
681
9,459
Unrealized gains (losses) relating to investments sold
1,175
(4,019)
Unrealized gains relating to investments still held
8,833
7,778
Balance, end of year
$ 191,814
$ 185,227
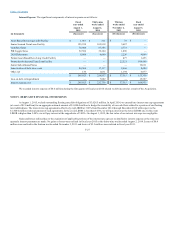
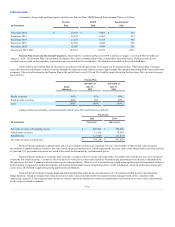
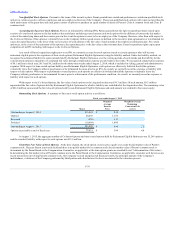
Assumptions. Significant assumptions related to the calculation of our obligations pursuant to our employee benefit plans include the discount
rates used to calculate the present value of benefit obligations to be paid in the future, the expected long-term rate of return on assets held by our Pension
Plan and the health care cost trend rate for the Postretirement Plan. We review these assumptions annually based upon currently available information. The
assumptions we utilized in calculating the projected benefit obligations and periodic expense of our Pension Plan, SERP Plan and Postretirement Plan are as
follows:
Pension Plan:
Discount rate
4.30%
4.35%
4.80%
4.70%
Expected long-term rate of return on plan assets
6.00%
6.50%
6.50%
6.50%
SERP Plan:
Discount rate
4.15%
4.20%
4.60%
4.50%
Postretirement Plan:
Discount rate
4.15%
4.25%
4.80%
4.70%
Initial health care cost trend rate
7.50%
8.00%
8.00%
8.00%
Ultimate health care cost trend rate
5.00%
5.00%
8.00%
8.00%
Discount rate. The assumed discount rate utilized is based on a broad sample of Moody’s high quality corporate bond yields as of the measurement
date. The projected benefit payments are matched with the yields on these bonds to determine an appropriate discount rate for the plan. The discount rate is
utilized principally in calculating the present values of our benefit obligations and related expenses.
Expected long-term rate of return on plan assets. The assumed expected long-term rate of return on assets is the weighted average rate of earnings
expected on the funds invested or to be invested by the Pension Plan to provide for the plan’s obligations. At August 1, 2015, the expected long-term rate of
return on plan assets was 6.0%. We estimate the expected average long-term rate of return on assets based on historical returns, our future asset performance
expectations using currently available market and other data and the advice of our outside actuaries and advisors. To the extent the actual rate of return on
assets realized over the course of a year is greater than the assumed rate, that year’s annual pension expense is not affected. Rather this gain reduces future
pension expense over a period of approximately 25 years. To the extent the actual rate of return on assets is less than the assumed rate, that year’s annual
pension expense is likewise not affected. Rather this loss increases pension expense over approximately 25 years.
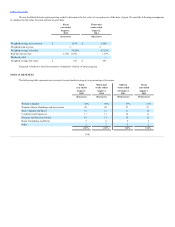
Health care cost trend rate. The assumed health care cost trend rate represents our estimate of the annual rates of change in the costs of the health
care benefits currently provided by the Postretirement Plan. The health care cost trend rate implicitly considers estimates of health care inflation, changes in
health care utilization and delivery patterns, technological advances and changes in the health status of the plan participants. We currently estimate that a
1% increase in the ultimate health care cost trend rate would (i) increase our projected benefit obligation by $1.1 million and (ii) increase our expense
requirements by $0.1 million.
F-34