Neiman Marcus 2014 Annual Report Download - page 107
Download and view the complete annual report
Please find page 107 of the 2014 Neiman Marcus annual report below. You can navigate through the pages in the report by either clicking on the pages listed below, or by using the keyword search tool below to find specific information within the annual report.-
 1
1 -
2
-
3
-
4
-
5
-
6
-
7
-
8
-
9
-
10
-
11
-
12
-
13
-
14
-
15
-
16
-
17
-
18
-
19
-
20
-
21
-
22
-
23
-
24
-
25
-
26
-
27
-
28
-
29
-
30
-
31
-
32
-
33
-
34
-
35
-
36
-
37
-
38
-
39
-
40
-
41
-
42
-
43
-
44
-
45
-
46
-
47
-
48
-
49
-
50
-
51
-
52
-
53
-
54
-
55
-
56
-
57
-
58
-
59
-
60
-
61
-
62
-
63
-
64
-
65
-
66
-
67
-
68
-
69
-
70
-
71
-
72
-
73
-
74
-
75
-
76
-
77
-
78
-
79
-
80
-
81
-
82
-
83
-
84
-
85
-
86
-
87
-
88
-
89
-
90
-
91
-
92
-
93
-
94
-
95
-
96
-
 97
97 -
 98
98 -
 99
99 -
 100
100 -
 101
101 -
 102
102 -
 103
103 -
 104
104 -
 105
105 -
 106
106 -
 107
107 -
 108
108 -
 109
109 -
 110
110 -
 111
111 -
 112
112 -
 113
113 -
 114
114 -
 115
115 -
 116
116 -
 117
117 -
118
-
119
-
120
-
121
-
122
-
123
-
124
-
125
-
126
-
127
-
128
-
129
-
130
-
131
-
132
-
133
-
134
-
135
-
136
-
137
-
138
-
139
-
140
-
141
-
142
-
143
-
144
-
145
-
146
-
147
-
148
-
149
-
150
-
151
-
152
-
153
-
154
-
155
-
156
-
157
-
158
-
159
-
160
-
161
 |
 |
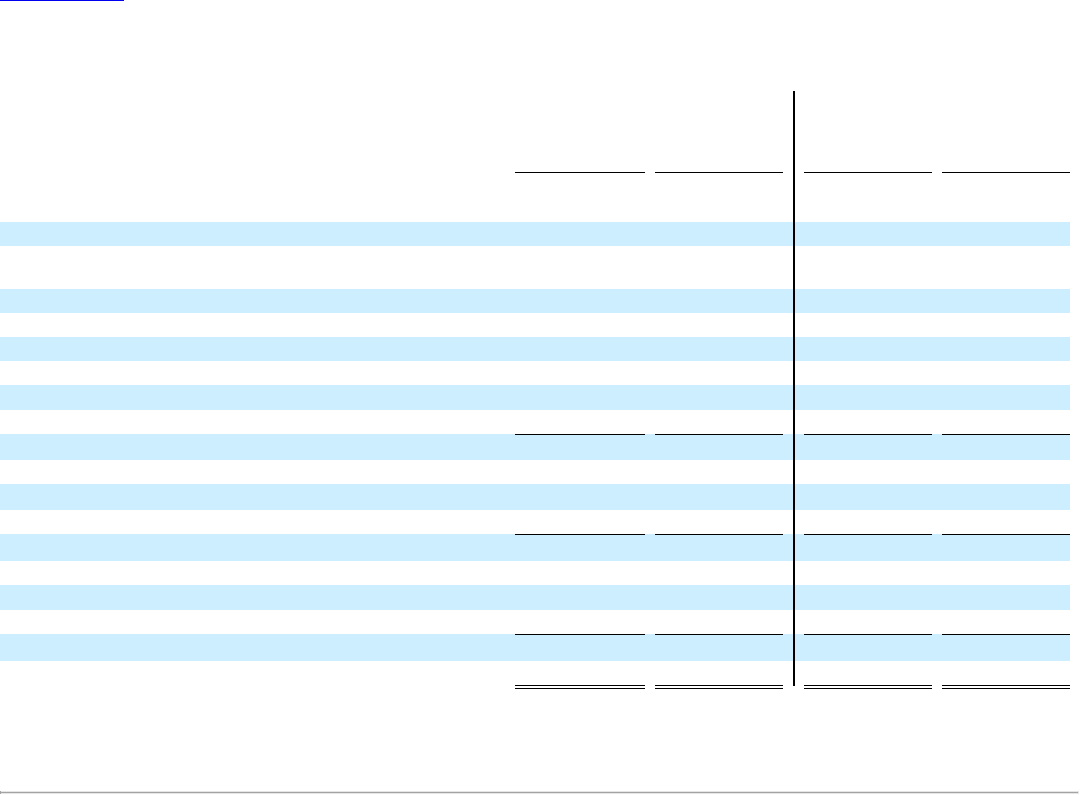
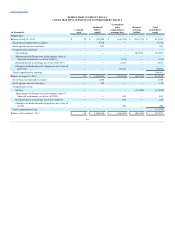
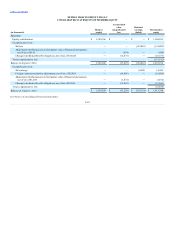
Table of Contents
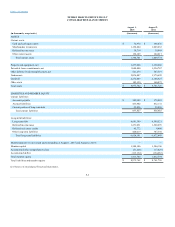
Revenues
$ 5,095,087
$ 3,710,193
$ 1,129,138
$ 4,648,249
Cost of goods sold including buying and occupancy costs (excluding
depreciation)
3,305,478
2,562,988
685,408
2,995,363
Selling, general and administrative expenses (excluding depreciation)
1,162,075
835,006
266,388
1,047,796
Income from credit card program
(52,769)
(40,672)
(14,653)
(53,373)
Depreciation expense
185,550
113,334
34,239
141,515
Amortization of intangible assets
82,953
108,052
7,251
29,559
Amortization of favorable lease commitments
54,327
40,574
4,469
17,877
Other expenses
39,474
82,080
113,900
23,125
Operating earnings
317,999
8,831
32,136
446,387
Interest expense, net
289,923
232,739
37,315
168,955
Earnings (loss) before income taxes
28,076
(223,908)
(5,179)
277,432
Income tax expense (benefit)
13,127
(89,825)
7,919
113,733
Net earnings (loss)
$ 14,949
$ (134,083)
$ (13,098)
$ 163,699
See Notes to Consolidated Financial Statements.
F-6