Neiman Marcus 2014 Annual Report Download - page 45
Download and view the complete annual report
Please find page 45 of the 2014 Neiman Marcus annual report below. You can navigate through the pages in the report by either clicking on the pages listed below, or by using the keyword search tool below to find specific information within the annual report.-
 1
1 -
2
-
3
-
4
-
5
-
6
-
7
-
8
-
9
-
10
-
11
-
12
-
13
-
14
-
15
-
16
-
17
-
18
-
19
-
20
-
21
-
22
-
23
-
24
-
25
-
26
-
27
-
28
-
29
-
30
-
31
-
32
-
33
-
34
-
 35
35 -
 36
36 -
 37
37 -
 38
38 -
 39
39 -
 40
40 -
 41
41 -
 42
42 -
 43
43 -
 44
44 -
 45
45 -
 46
46 -
 47
47 -
 48
48 -
 49
49 -
 50
50 -
 51
51 -
 52
52 -
 53
53 -
 54
54 -
 55
55 -
56
-
57
-
58
-
59
-
60
-
61
-
62
-
63
-
64
-
65
-
66
-
67
-
68
-
69
-
70
-
71
-
72
-
73
-
74
-
75
-
76
-
77
-
78
-
79
-
80
-
81
-
82
-
83
-
84
-
85
-
86
-
87
-
88
-
89
-
90
-
91
-
92
-
93
-
94
-
95
-
96
-
97
-
98
-
99
-
100
-
101
-
102
-
103
-
104
-
105
-
106
-
107
-
108
-
109
-
110
-
111
-
112
-
113
-
114
-
115
-
116
-
117
-
118
-
119
-
120
-
121
-
122
-
123
-
124
-
125
-
126
-
127
-
128
-
129
-
130
-
131
-
132
-
133
-
134
-
135
-
136
-
137
-
138
-
139
-
140
-
141
-
142
-
143
-
144
-
145
-
146
-
147
-
148
-
149
-
150
-
151
-
152
-
153
-
154
-
155
-
156
-
157
-
158
-
159
-
160
-
161
 |
 |

Table of Contents
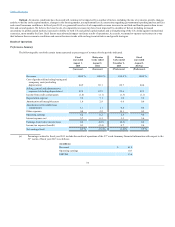
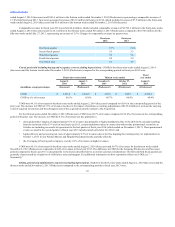
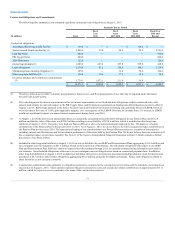
SG&A
$ 835.0
$ 790.7
$ 266.4
$ 257.1
$ 1,047.8
SG&A as a % of revenues
22.5%
22.1%
23.6%
24.1%
22.5%
SG&A expenses as a percentage of revenues increased 0.4% of revenues to 22.5% in the thirty-nine weeks ended August 2, 2014 (Successor)
compared to 22.1% of revenues in the corresponding period of the prior year due primarily to:
• higher marketing and selling costs of approximately 0.3% of revenues incurred primarily in support of the growth of our online operations; and
• higher current and long-term incentive compensation costs by approximately 0.2% of revenues; partially offset by
• favorable payroll and other costs of approximately 0.2% of revenues due primarily to the leveraging of these expenses on higher revenues.
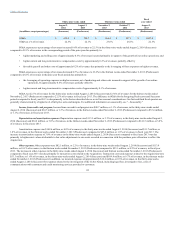
SG&A expenses as a percentage of revenues decreased 0.5% of revenues to 23.6% in the thirteen weeks ended November 2, 2013 (Predecessor)
compared to 24.1% of revenues in the prior year fiscal period due primarily to:
• the leveraging of operating expenses on higher revenues, net of marketing and other costs incurred in support of the growth of our online
operations, by approximately 0.6% of revenues; partially offset by
• higher current and long-term incentive compensation costs of approximately 0.1% of revenues.
SG&A was 22.5% of revenues for the thirty-nine weeks ended August 2, 2014 (Successor) and 23.6% of revenues for the thirteen weeks ended
November 2, 2013 (Predecessor) compared to 22.5% of revenues in fiscal year 2013. The difference in SG&A for the foregoing Predecessor and Successor
periods compared to fiscal year 2013 is due primarily to the factors described above as well as seasonal considerations. Our first and third fiscal quarters are
generally characterized by a higher level of full-price sales and margins. For additional information on seasonality, see "—Seasonality."
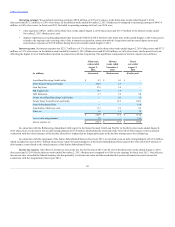
Income from credit card program. Income from our credit card program was $40.7 million, or 1.1% of revenues, in the thirty-nine weeks ended
August 2, 2014 (Successor) and $14.7 million, or 1.3% of revenues, in the thirteen weeks ended November 2, 2013 (Predecessor) compared to $53.4 million,
or 1.1% of revenues, in fiscal year 2013.
Depreciation and amortization expenses. Depreciation expense was $113.3 million, or 3.1% of revenues, in the thirty-nine weeks ended August 2,
2014 (Successor) and $34.2 million, or 3.0% of revenues, in the thirteen weeks ended November 2, 2013 (Predecessor) compared to $141.5 million, or 3.0%
of revenues, in fiscal year 2013.
Amortization expense was $148.6 million, or 4.0% of revenues, in the thirty-nine weeks ended August 2, 2014 (Successor) and $11.7 million, or
1.0% of revenues, in the thirteen weeks ended November 2, 2013 (Predecessor) compared to $47.4 million, or 1.0% of revenues, in fiscal year 2013. The
increase in amortization expense of 3.0% of revenues in the thirty-nine weeks ended August 2, 2014 (Successor) compared to fiscal year 2013 was due
primarily to higher asset values attributable to fair value adjustments to our assets recorded in connection with the purchase price allocation to reflect the
Acquisition.
Other expenses. Other expenses were $82.1 million, or 2.2% of revenues, in the thirty-nine weeks ended August 2, 2014 (Successor) and $113.9
million, or 10.1% of revenues, in the thirteen weeks ended November 2, 2013 (Predecessor) compared to $23.1 million, or 0.5% of revenues, in fiscal year
2013. The increase in other expenses in the thirty-nine weeks ended August 2, 2014 (Successor) and thirteen weeks ended November 2, 2013 (Predecessor)
compared to fiscal year 2013 was due primarily to transaction costs related to the Acquisition. Transaction costs and expenses related to the Acquisition were
$53.3 million, or 1.4% of revenues, in the thirty-nine weeks ended August 2, 2014 (Successor) and $109.4 million, or 9.7% of revenues, in the thirteen weeks
ended November 2, 2013 (Predecessor). In addition, we incurred expenses of approximately $12.6 million, or 0.3% of revenues, in the thirty-nine weeks
ended August 2, 2014 (Successor) for expenses related to the investigation of the Cyber-Attack, including legal fees, investigative fees, costs of
communications with customers and credit monitoring services provided to customers.
44