Neiman Marcus 2014 Annual Report Download - page 35
Download and view the complete annual report
Please find page 35 of the 2014 Neiman Marcus annual report below. You can navigate through the pages in the report by either clicking on the pages listed below, or by using the keyword search tool below to find specific information within the annual report.-
 1
1 -
2
-
3
-
4
-
5
-
6
-
7
-
8
-
9
-
10
-
11
-
12
-
13
-
14
-
15
-
16
-
17
-
18
-
19
-
20
-
21
-
22
-
23
-
24
-
 25
25 -
 26
26 -
 27
27 -
 28
28 -
 29
29 -
 30
30 -
 31
31 -
 32
32 -
 33
33 -
 34
34 -
 35
35 -
 36
36 -
 37
37 -
 38
38 -
 39
39 -
 40
40 -
 41
41 -
 42
42 -
 43
43 -
 44
44 -
 45
45 -
46
-
47
-
48
-
49
-
50
-
51
-
52
-
53
-
54
-
55
-
56
-
57
-
58
-
59
-
60
-
61
-
62
-
63
-
64
-
65
-
66
-
67
-
68
-
69
-
70
-
71
-
72
-
73
-
74
-
75
-
76
-
77
-
78
-
79
-
80
-
81
-
82
-
83
-
84
-
85
-
86
-
87
-
88
-
89
-
90
-
91
-
92
-
93
-
94
-
95
-
96
-
97
-
98
-
99
-
100
-
101
-
102
-
103
-
104
-
105
-
106
-
107
-
108
-
109
-
110
-
111
-
112
-
113
-
114
-
115
-
116
-
117
-
118
-
119
-
120
-
121
-
122
-
123
-
124
-
125
-
126
-
127
-
128
-
129
-
130
-
131
-
132
-
133
-
134
-
135
-
136
-
137
-
138
-
139
-
140
-
141
-
142
-
143
-
144
-
145
-
146
-
147
-
148
-
149
-
150
-
151
-
152
-
153
-
154
-
155
-
156
-
157
-
158
-
159
-
160
-
161
 |
 |
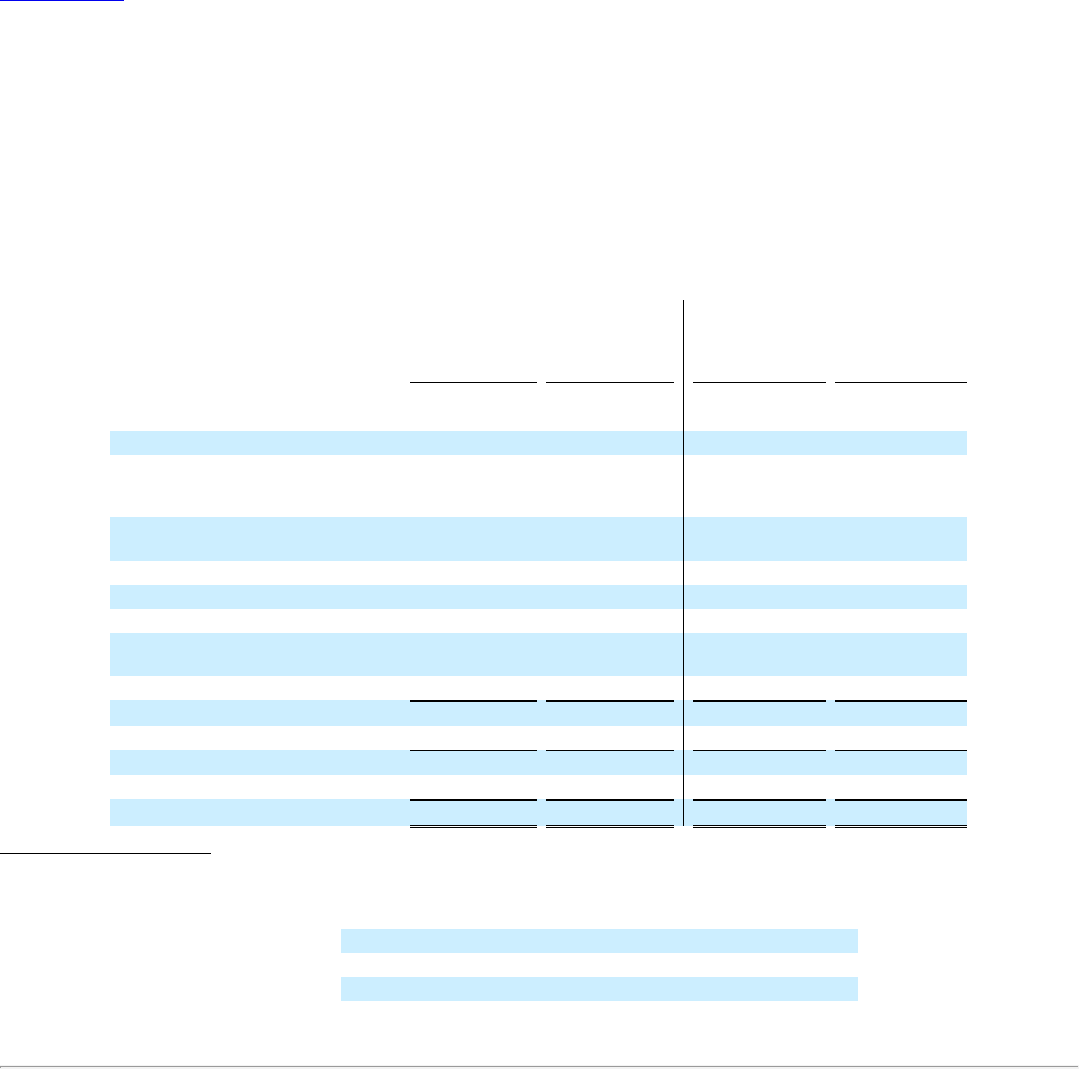
Table of Contents
- Economic conditions have been and will continue to be impacted by a number of factors, including the rate of economic growth, changes
and the volatility in the capital markets, changes in the housing market, unemployment levels, uncertainty regarding governmental spending and tax policies
and overall consumer confidence. In fiscal year 2015, we generated lower levels of comparable revenue increases in our third and fourth quarters than in our
first and second quarters. We believe the lower levels of comparable revenues may have been impacted by a number of factors including increased
uncertainty in global capital markets, increased volatility in both U.S. and global capital markets and a strengthening of the U.S. dollar against international
currencies, most notably the Euro. Such factors may adversely impact our future results of operations. As a result, we intend to operate our business in a way
that balances these economic conditions and current business trends with our long-term initiatives and growth strategies.
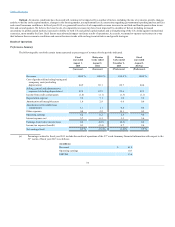
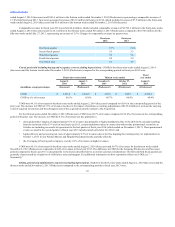
Performance Summary
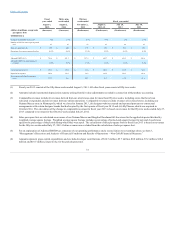
The following table sets forth certain items expressed as percentages of revenues for the periods indicated.
Revenues
100.0 %
100.0 %
100.0 %
100.0 %
Cost of goods sold including buying and
occupancy costs (excluding
depreciation)
64.9
69.1
60.7
64.4
Selling, general and administrative
expenses (excluding depreciation)
22.8
22.5
23.6
22.5
Income from credit card program
(1.0)
(1.1)
(1.3)
(1.1)
Depreciation expense
3.6
3.1
3.0
3.0
Amortization of intangible assets
1.6
2.9
0.6
0.6
Amortization of favorable lease
commitments
1.1
1.1
0.4
0.4
Other expenses
0.8
2.2
10.1
0.5
Operating earnings
6.2
0.2
2.8
9.6
Interest expense, net
5.7
6.3
3.3
3.6
Earnings (loss) before income taxes
0.6
(6.0)
(0.5)
6.0
Income tax expense (benefit)
0.3
(2.4)
0.7
2.4
Net earnings (loss)
0.3 %
(3.6)%
(1.2)%
3.5 %
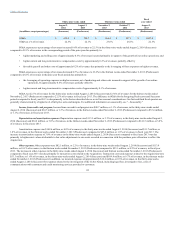
(a) Percentages related to fiscal year 2013 include the results of operations of the 53rd week. Summary financial information with respect to the
53rd weeks of fiscal year 2013 is as follows:
Revenues
$ 61.9
Operating earnings
10.7
EBITDA
13.6
34