Neiman Marcus 2014 Annual Report Download - page 117
Download and view the complete annual report
Please find page 117 of the 2014 Neiman Marcus annual report below. You can navigate through the pages in the report by either clicking on the pages listed below, or by using the keyword search tool below to find specific information within the annual report.-
 1
1 -
2
-
3
-
4
-
5
-
6
-
7
-
8
-
9
-
10
-
11
-
12
-
13
-
14
-
15
-
16
-
17
-
18
-
19
-
20
-
21
-
22
-
23
-
24
-
25
-
26
-
27
-
28
-
29
-
30
-
31
-
32
-
33
-
34
-
35
-
36
-
37
-
38
-
39
-
40
-
41
-
42
-
43
-
44
-
45
-
46
-
47
-
48
-
49
-
50
-
51
-
52
-
53
-
54
-
55
-
56
-
57
-
58
-
59
-
60
-
61
-
62
-
63
-
64
-
65
-
66
-
67
-
68
-
69
-
70
-
71
-
72
-
73
-
74
-
75
-
76
-
77
-
78
-
79
-
80
-
81
-
82
-
83
-
84
-
85
-
86
-
87
-
88
-
89
-
90
-
91
-
92
-
93
-
94
-
95
-
96
-
97
-
98
-
99
-
100
-
101
-
102
-
103
-
104
-
105
-
106
-
 107
107 -
 108
108 -
 109
109 -
 110
110 -
 111
111 -
 112
112 -
 113
113 -
 114
114 -
 115
115 -
 116
116 -
 117
117 -
 118
118 -
 119
119 -
 120
120 -
 121
121 -
 122
122 -
 123
123 -
 124
124 -
 125
125 -
 126
126 -
 127
127 -
128
-
129
-
130
-
131
-
132
-
133
-
134
-
135
-
136
-
137
-
138
-
139
-
140
-
141
-
142
-
143
-
144
-
145
-
146
-
147
-
148
-
149
-
150
-
151
-
152
-
153
-
154
-
155
-
156
-
157
-
158
-
159
-
160
-
161
 |
 |

Table of Contents
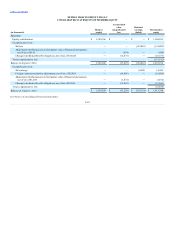
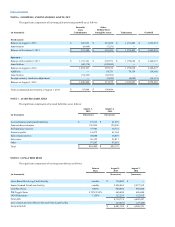
Revenues are reduced when customers return goods previously purchased. We maintain reserves for anticipated sales returns primarily based on our
historical trends related to returns by our customers. Our reserves for anticipated sales returns were $44.0 million at August 1, 2015 and $38.9 million at
August 2, 2014.
Between 2005 and 2014, we created and maintained e‑commerce websites pursuant to contractual arrangements with certain designers. Pursuant to
these arrangements, we purchased and maintained inventory from such designers that was showcased on their respective websites and bore all responsibilities
related to the fulfillment of goods purchased on such websites. All of these contractual arrangements expired by the end of the first quarter of fiscal year 2015
and were not renewed. Revenues generated from the operation of the designer websites were $4.7 million in fiscal year 2015, $70.0 million for the thirty‑nine
weeks ended August 2, 2014, $13.5 million for the thirteen weeks ended November 2, 2013 and $66.5 million in fiscal year 2013.
Buying and Occupancy Costs. Our buying costs consist primarily of salaries and expenses incurred by our merchandising and buying operations.
Occupancy costs primarily include rent, property taxes and operating costs of our retail, distribution and support facilities and exclude depreciation expense.
Selling, General and Administrative Expenses (excluding depreciation). Selling, general and administrative expenses are comprised principally of
the costs related to employee compensation and benefits in the selling and administrative support areas and advertising and marketing costs.
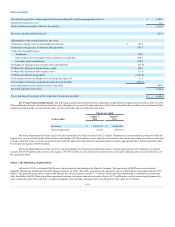
We receive allowances from certain merchandise vendors in connection with compensation programs for employees who sell the vendors’
merchandise. These allowances are netted against the related compensation expenses that we incur. Amounts received from vendors related to compensation
programs were $76.4 million in fiscal year 2015, $55.4 million for the thirty-nine weeks ended August 2, 2014, $18.5 million for the thirteen weeks ended
November 2, 2013 and $72.2 million in fiscal year 2013.
Consistent with industry practice, we receive advertising allowances from certain of our merchandise vendors. Substantially all the advertising
allowances we receive represent reimbursements of direct, specific and incremental costs that we incur to promote the vendor’s merchandise in connection
with our various advertising programs, primarily catalogs and other print media. Advertising allowances fluctuate based on the level of advertising expenses
incurred and are recorded as a reduction of our advertising costs when earned. Advertising allowances were approximately $55.0 million in fiscal year 2015,
$31.4 million for the thirty-nine weeks ended August 2, 2014, $20.0 million for the thirteen weeks ended November 2, 2013 and $55.0 million in fiscal year
2013.
We incur costs to advertise and promote the merchandise assortment offered through our store and online operations. We expense advertising costs
for print media costs and promotional materials mailed to our customers at the time of mailing to the customer. We amortize the costs of print catalogs during
the periods we expect to generate revenues from such catalogs, generally three to six months. We expense the costs incurred to produce the photographic
content on our websites, as well as website design and web marketing costs, as incurred. Net marketing and advertising expenses were $165.7 million in
fiscal year 2015, $109.7 million for the thirty-nine weeks ended August 2, 2014, $34.6 million for the thirteen weeks ended November 2, 2013 and $126.9
million in fiscal year 2013.
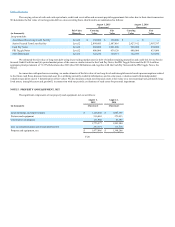
Stock Compensation. At the date of grant, the stock option exercise price equals or exceeds the fair market value of Parent's common stock.
Because Parent is privately held and there is no public market for its common stock, the fair market value of Parent's common stock is determined by the
Board of Directors of Parent (the Parent Board) or the Compensation Committee, as applicable, at the time option grants are awarded. The estimation of the
fair market value of Parent's common stock utilizes both discounted cash flow techniques and the review of market data and involves assumptions regarding a
number of complex and subjective variables. Significant inputs to the common stock valuation model include:
• future revenue, cash flow and/or profitability projections;
• growth assumptions for future revenues as well as future gross margin rates, expense rates, capital expenditures and other estimates;
• rates, based on our estimated weighted average cost of capital, used to discount the estimated cash flow projections to their present value (or
estimated fair value);
• recent transactions and valuation multiples for publicly held companies deemed similar to Parent;
F-15