Neiman Marcus 2014 Annual Report Download - page 46
Download and view the complete annual report
Please find page 46 of the 2014 Neiman Marcus annual report below. You can navigate through the pages in the report by either clicking on the pages listed below, or by using the keyword search tool below to find specific information within the annual report.-
 1
1 -
2
-
3
-
4
-
5
-
6
-
7
-
8
-
9
-
10
-
11
-
12
-
13
-
14
-
15
-
16
-
17
-
18
-
19
-
20
-
21
-
22
-
23
-
24
-
25
-
26
-
27
-
28
-
29
-
30
-
31
-
32
-
33
-
34
-
35
-
 36
36 -
 37
37 -
 38
38 -
 39
39 -
 40
40 -
 41
41 -
 42
42 -
 43
43 -
 44
44 -
 45
45 -
 46
46 -
 47
47 -
 48
48 -
 49
49 -
 50
50 -
 51
51 -
 52
52 -
 53
53 -
 54
54 -
 55
55 -
 56
56 -
57
-
58
-
59
-
60
-
61
-
62
-
63
-
64
-
65
-
66
-
67
-
68
-
69
-
70
-
71
-
72
-
73
-
74
-
75
-
76
-
77
-
78
-
79
-
80
-
81
-
82
-
83
-
84
-
85
-
86
-
87
-
88
-
89
-
90
-
91
-
92
-
93
-
94
-
95
-
96
-
97
-
98
-
99
-
100
-
101
-
102
-
103
-
104
-
105
-
106
-
107
-
108
-
109
-
110
-
111
-
112
-
113
-
114
-
115
-
116
-
117
-
118
-
119
-
120
-
121
-
122
-
123
-
124
-
125
-
126
-
127
-
128
-
129
-
130
-
131
-
132
-
133
-
134
-
135
-
136
-
137
-
138
-
139
-
140
-
141
-
142
-
143
-
144
-
145
-
146
-
147
-
148
-
149
-
150
-
151
-
152
-
153
-
154
-
155
-
156
-
157
-
158
-
159
-
160
-
161
 |
 |

Table of Contents
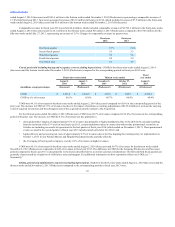
Operating earnings. We generated operating earnings of $8.8 million, or 0.2% of revenues, in the thirty-nine weeks ended August 2, 2014
(Successor) and $32.1 million, or 2.8% of revenues, in the thirteen weeks ended November 2, 2013 (Predecessor) compared to operating earnings of $446.4
million, or 9.6% of revenues, in fiscal year 2013. Included in operating earnings in fiscal year 2014 were:
• other expenses of $82.1 million in the thirty-nine weeks ended August 2, 2014 (Successor) and $113.9 million in the thirteen weeks ended
November 2, 2013 (Predecessor); and
• impacts of purchase accounting adjustments that increased COGS by $129.6 million in the thirty-nine weeks ended August 2, 2014 (Successor)
related to the step-up in the carrying value of the inventories acquired in connection with the Acquisition and increased depreciation and
amortization expenses of $119.0 million during the twelve months ended August 2, 2014.
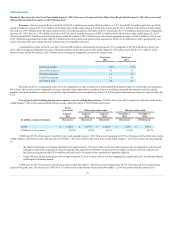
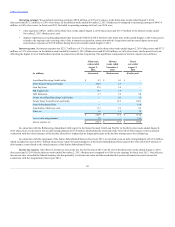
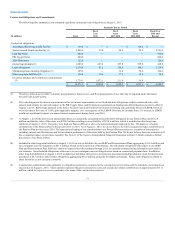
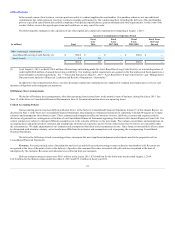
Interest expense. Net interest expense was $232.7 million, or 6.3% of revenues, in the thirty-nine weeks ended August 2, 2014 (Successor) and $37.3
million, or 3.3% of revenues, in the thirteen weeks ended November 2, 2013 (Predecessor) and $169.0 million, or 3.6% of revenues, for the prior fiscal year,
reflecting the higher level of indebtedness incurred in connection with the Acquisition. The significant components of interest expense are as follows:
Asset-Based Revolving Credit Facility
$ 0.3
$ 0.1
$ —
Senior Secured Term Loan Facility
102.8
3.7
—
Cash Pay Notes
57.6
2.8
—
PIK Toggle Notes
39.3
1.9
—
2028 Debentures
6.7
2.2
9.0
Former Asset-Based Revolving Credit Facility
—
0.5
1.5
Former Senior Secured Term Loan Facility
—
22.5
108.5
Senior Subordinated Notes
—
—
19.0
Amortization of debt issue costs
17.1
2.5
8.4
Other, net
1.0
1.2
7.0
$ 224.9
$ 37.3
$ 153.4
Loss on debt extinguishment
7.9
—
15.6
Interest expense, net
$ 232.7
$ 37.3
$ 169.0
In connection with the Refinancing Amendment with respect to the Senior Secured Term Loan Facility in the thirty-nine weeks ended August 2,
2014 (Successor), we incurred a loss on debt extinguishment of $7.9 million, which primarily consisted of the write-off of debt issuance costs incurred in
connection with the initial issuance of the facility allocable to lenders that no longer participate in the facility subsequent to the refinancing.
In connection with the repayment of the Senior Subordinated Notes in fiscal year 2013, we incurred a loss on debt extinguishment of $15.6 million,
which included (i) costs of $10.7 million related to the tender for and redemption of the Senior Subordinated Notes and (ii) the write-off of $4.9 million of
debt issuance costs related to the initial issuance of the Senior Subordinated Notes.
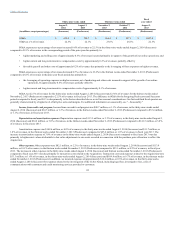
Income tax expense. Our effective income tax rate on the net loss for fiscal year 2014 was 40.1% for the thirty-nine weeks ended August 2, 2014
(Successor) and 152.9% for the thirteen weeks ended November 2, 2013 (Predecessor) compared to 41.0% on net earnings for fiscal year 2013. Our effective
income tax rates exceeded the federal statutory rate due primarily to state income taxes and the non-deductible portion of transaction costs incurred in
connection with the Acquisition in fiscal year 2014.
45