Neiman Marcus 2014 Annual Report Download - page 141
Download and view the complete annual report
Please find page 141 of the 2014 Neiman Marcus annual report below. You can navigate through the pages in the report by either clicking on the pages listed below, or by using the keyword search tool below to find specific information within the annual report.-
 1
1 -
2
-
3
-
4
-
5
-
6
-
7
-
8
-
9
-
10
-
11
-
12
-
13
-
14
-
15
-
16
-
17
-
18
-
19
-
20
-
21
-
22
-
23
-
24
-
25
-
26
-
27
-
28
-
29
-
30
-
31
-
32
-
33
-
34
-
35
-
36
-
37
-
38
-
39
-
40
-
41
-
42
-
43
-
44
-
45
-
46
-
47
-
48
-
49
-
50
-
51
-
52
-
53
-
54
-
55
-
56
-
57
-
58
-
59
-
60
-
61
-
62
-
63
-
64
-
65
-
66
-
67
-
68
-
69
-
70
-
71
-
72
-
73
-
74
-
75
-
76
-
77
-
78
-
79
-
80
-
81
-
82
-
83
-
84
-
85
-
86
-
87
-
88
-
89
-
90
-
91
-
92
-
93
-
94
-
95
-
96
-
97
-
98
-
99
-
100
-
101
-
102
-
103
-
104
-
105
-
106
-
107
-
108
-
109
-
110
-
111
-
112
-
113
-
114
-
115
-
116
-
117
-
118
-
119
-
120
-
121
-
122
-
123
-
124
-
125
-
126
-
127
-
128
-
129
-
130
-
 131
131 -
 132
132 -
 133
133 -
 134
134 -
 135
135 -
 136
136 -
 137
137 -
 138
138 -
 139
139 -
 140
140 -
 141
141 -
 142
142 -
 143
143 -
 144
144 -
 145
145 -
 146
146 -
 147
147 -
 148
148 -
 149
149 -
 150
150 -
 151
151 -
152
-
153
-
154
-
155
-
156
-
157
-
158
-
159
-
160
-
161
 |
 |
Table of Contents
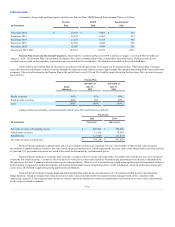
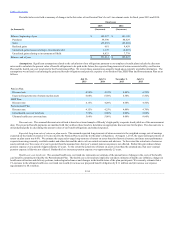
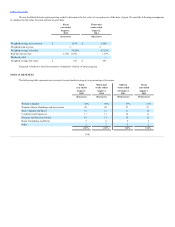
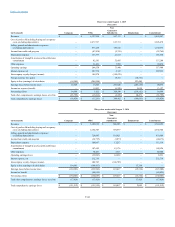
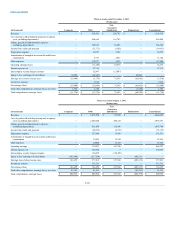
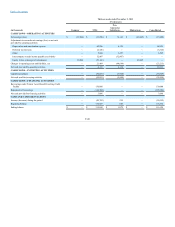
The following table summarizes the changes in accumulated other comprehensive loss by component (amounts are recorded net of related income
taxes):
Balance, August 2, 2014
$ —
$ (954)
$ (16,475)
$ (17,429)
Other comprehensive loss
(16,886)
(1,872)
(15,041)
(33,799)
Balance, August 1, 2015
$ (16,886)
$ (2,826)
$ (31,516)
$ (51,228)
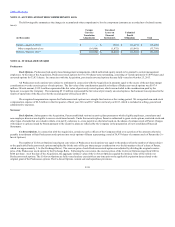
Stock Options. Predecessor had equity-based management arrangements, which authorized equity awards to be granted to certain management
employees. At the time of the Acquisition, Predecessor stock options for 101,730 shares were outstanding, consisting of vested options for 67,899 shares and
unvested options for 33,831 shares. In connection with the Acquisition, previously unvested options became fully vested on October 25, 2013.
All Predecessor stock options were subject to settlement in connection with the Acquisition in amounts equal to the excess of the per share merger
consideration over the exercise prices of such options. The fair value of the consideration payable to holders of Predecessor stock options was $187.4
million. Of such amount, $135.9 million represented the fair value of previously vested options, which was included in the consideration paid by the
Sponsors to acquire the Company. The remaining $51.5 million represented the fair value of previously unvested options. Such amount was expensed in the
results of operations of the Successor for the second quarter of fiscal year 2014.
We recognized compensation expense for Predecessor stock options on a straight-line basis over the vesting period. We recognized non-cash stock
compensation expense of $2.5 million in the first quarter of fiscal year 2014 and $9.7 million in fiscal year 2013, which is included in selling, general and
administrative expenses.
Stock Options. Subsequent to the Acquisition, Parent established various incentive plans pursuant to which eligible employees, consultants and
non-employee directors are eligible to receive stock-based awards. Under the incentive plans, Parent is authorized to grant stock options, restricted stock and
other types of awards that are valued in whole or in part by reference to, or are payable or otherwise based on, the shares of common stock of Parent. Charges
with respect to options issued by Parent pursuant to the incentive plans are reflected by the Company in the preparation of our Consolidated Financial
Statements.
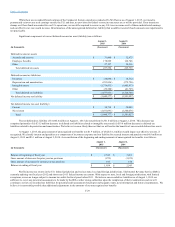
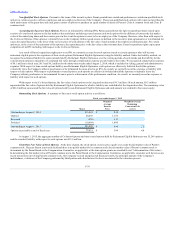
Co-Invest Options. In connection with the Acquisition, certain executive officers of the Company rolled over a portion of the amounts otherwise
payable in settlement of their Predecessor stock options into stock options of Parent representing a total of 56,979 shares of common stock of Parent (the Co-
Invest Options).
The number of Co-Invest Options issued upon conversion of Predecessor stock options was equal to the product of (a) the number of shares subject
to the applicable Predecessor stock options multiplied by (b) the ratio of the per share merger consideration over the fair market value of a share of Parent,
which was approximately 3.1x (the Exchange Ratio). The exercise price of each Predecessor stock option was adjusted by dividing the original exercise
price of the Predecessor stock option by the Exchange Ratio. Following the conversion, the exercise prices of the Co-Invest Options range from $180 to
$644 per share. As of the date of the Acquisition, the aggregate intrinsic value of the Co-Invest Options equaled the intrinsic value of the rolled over
Predecessor stock options. The Co-Invest Options are fully vested and are exercisable at any time prior to the applicable expiration dates related to the
original grant of the Predecessor options. The Co-Invest Options contain sale and repurchase provisions.
F-38