Neiman Marcus 2014 Annual Report Download - page 40
Download and view the complete annual report
Please find page 40 of the 2014 Neiman Marcus annual report below. You can navigate through the pages in the report by either clicking on the pages listed below, or by using the keyword search tool below to find specific information within the annual report.-
 1
1 -
2
-
3
-
4
-
5
-
6
-
7
-
8
-
9
-
10
-
11
-
12
-
13
-
14
-
15
-
16
-
17
-
18
-
19
-
20
-
21
-
22
-
23
-
24
-
25
-
26
-
27
-
28
-
29
-
 30
30 -
 31
31 -
 32
32 -
 33
33 -
 34
34 -
 35
35 -
 36
36 -
 37
37 -
 38
38 -
 39
39 -
 40
40 -
 41
41 -
 42
42 -
 43
43 -
 44
44 -
 45
45 -
 46
46 -
 47
47 -
 48
48 -
 49
49 -
 50
50 -
51
-
52
-
53
-
54
-
55
-
56
-
57
-
58
-
59
-
60
-
61
-
62
-
63
-
64
-
65
-
66
-
67
-
68
-
69
-
70
-
71
-
72
-
73
-
74
-
75
-
76
-
77
-
78
-
79
-
80
-
81
-
82
-
83
-
84
-
85
-
86
-
87
-
88
-
89
-
90
-
91
-
92
-
93
-
94
-
95
-
96
-
97
-
98
-
99
-
100
-
101
-
102
-
103
-
104
-
105
-
106
-
107
-
108
-
109
-
110
-
111
-
112
-
113
-
114
-
115
-
116
-
117
-
118
-
119
-
120
-
121
-
122
-
123
-
124
-
125
-
126
-
127
-
128
-
129
-
130
-
131
-
132
-
133
-
134
-
135
-
136
-
137
-
138
-
139
-
140
-
141
-
142
-
143
-
144
-
145
-
146
-
147
-
148
-
149
-
150
-
151
-
152
-
153
-
154
-
155
-
156
-
157
-
158
-
159
-
160
-
161
 |
 |

Table of Contents
Results of Operations for the Fiscal Year Ended August 1, 2015 (Successor) Compared to the Thirty-Nine Weeks Ended August 2, 2014 (Successor) and
Thirteen Weeks Ended November 2, 2013 (Predecessor)
Revenues. Our revenues for fiscal year 2015 of $5,095.1 million increased by $255.8 million, or 5.3%, from $4,839.3 million in fiscal year 2014,
which included revenues of $3,710.2 million in the thirty-nine weeks ended August 2, 2014 (Successor) and $1,129.1 million in the thirteen weeks ended
November 2, 2013 (Predecessor). Revenues generated by our online operations in fiscal year 2015 increased to $1,338.4 million, representing a comparable
increase of 13.0%, from $1,154.2 million in fiscal year 2014, which included revenues of $912.6 million in the thirty-nine weeks ended August 2, 2014
(Successor) and $241.6 million in the thirteen weeks ended November 2, 2013 (Predecessor). New stores generated revenues of $26.7 million in fiscal year
2015. MyTheresa generated revenues of $122.7 million in the thirty-nine week period since acquisition, which are included in revenues generated by our
online operations but are excluded from all calculations of comparable revenues.
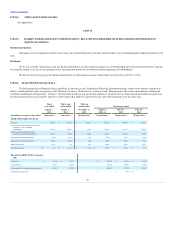
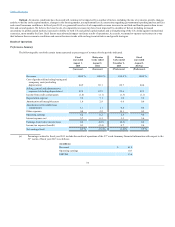
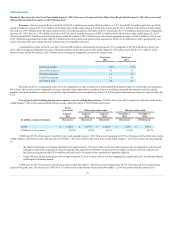
Comparable revenues for fiscal year 2015 were $4,944.6 million, representing an increase of 3.9%, compared to $4,759.8 million for fiscal year
2014, which included comparable revenues of $3,640.1 million in the thirty-nine weeks ended August 2, 2014 (Successor) and $1,119.7 million in the
thirteen weeks ended November 2, 2013 (Predecessor). Changes in comparable revenues by quarter were:
First fiscal quarter
5.5%
5.7%
Second fiscal quarter
5.6
5.5
Third fiscal quarter
2.2
5.9
Fourth fiscal quarter
1.9
4.9
Total fiscal year
3.9
5.5
In fiscal year 2015, we generated lower levels of comparable revenue increases in our third and fourth quarters than in our first and second quarters.
We believe the lower levels of comparable revenues may have been impacted by a number of factors including increased uncertainty in global capital
markets, increased volatility in both U.S. and global capital markets and a strengthening of the U.S. dollar against international currencies, most notably the
Euro.
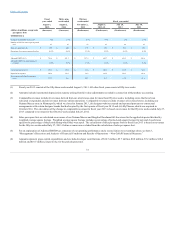
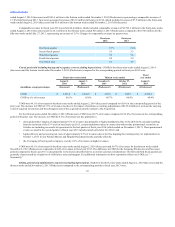
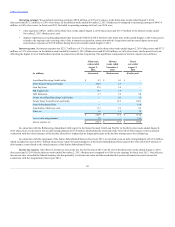
Cost of goods sold including buying and occupancy costs (excluding depreciation). COGS in fiscal year 2015 compared to the thirty-nine weeks
ended August 2, 2014 (Successor) and the thirteen weeks ended November 2, 2013 (Predecessor) were:
COGS
$ 3,305.5
$ 2,577.1
$ 2,563.0
$ 728.4
$ 685.4
COGS as a % of revenues
64.9%
65.9%
69.1%
61.4%
60.7%
COGS were 65.9% of revenues for the thirty-nine weeks ended August 1, 2015 (Successor) compared to 69.1% of revenues for the thirty-nine weeks
ended August 2, 2014 (Successor). The decrease in COGS by 3.2% of revenues in the thirty-nine weeks ended August 1, 2015 (Successor) was due primarily
to:
• the impact of purchase accounting adjustments of approximately 3.3% of revenues to increase the carrying value of acquired inventories and
subsequent sale of the acquired inventories related to the acquisitions (COGS were increased $6.8 million in fiscal year 2015 related to the
MyTheresa acquisition and $129.6 million in fiscal year 2014 related to the Acquisition); partially offset by
• higher delivery and processing net costs of approximately 0.2% of revenues due to our free shipping/free returns policy for our Neiman Marcus
and Bergdorf Goodman brands.
COGS were 61.4% of revenues for the thirteen weeks ended November 1, 2014 (Successor) compared to 60.7% of revenues in the corresponding
period of the prior year. The increase in COGS by 0.7% of revenues in the thirteen weeks ended November 1, 2014 (Successor) was due primarily to:
39