Neiman Marcus 2014 Annual Report Download - page 37
Download and view the complete annual report
Please find page 37 of the 2014 Neiman Marcus annual report below. You can navigate through the pages in the report by either clicking on the pages listed below, or by using the keyword search tool below to find specific information within the annual report.-
 1
1 -
2
-
3
-
4
-
5
-
6
-
7
-
8
-
9
-
10
-
11
-
12
-
13
-
14
-
15
-
16
-
17
-
18
-
19
-
20
-
21
-
22
-
23
-
24
-
25
-
26
-
 27
27 -
 28
28 -
 29
29 -
 30
30 -
 31
31 -
 32
32 -
 33
33 -
 34
34 -
 35
35 -
 36
36 -
 37
37 -
 38
38 -
 39
39 -
 40
40 -
 41
41 -
 42
42 -
 43
43 -
 44
44 -
 45
45 -
 46
46 -
 47
47 -
48
-
49
-
50
-
51
-
52
-
53
-
54
-
55
-
56
-
57
-
58
-
59
-
60
-
61
-
62
-
63
-
64
-
65
-
66
-
67
-
68
-
69
-
70
-
71
-
72
-
73
-
74
-
75
-
76
-
77
-
78
-
79
-
80
-
81
-
82
-
83
-
84
-
85
-
86
-
87
-
88
-
89
-
90
-
91
-
92
-
93
-
94
-
95
-
96
-
97
-
98
-
99
-
100
-
101
-
102
-
103
-
104
-
105
-
106
-
107
-
108
-
109
-
110
-
111
-
112
-
113
-
114
-
115
-
116
-
117
-
118
-
119
-
120
-
121
-
122
-
123
-
124
-
125
-
126
-
127
-
128
-
129
-
130
-
131
-
132
-
133
-
134
-
135
-
136
-
137
-
138
-
139
-
140
-
141
-
142
-
143
-
144
-
145
-
146
-
147
-
148
-
149
-
150
-
151
-
152
-
153
-
154
-
155
-
156
-
157
-
158
-
159
-
160
-
161
 |
 |

Table of Contents
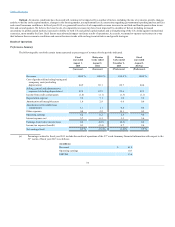
• Delivery and processing—We generate revenues from delivery and processing charges related to certain merchandise deliveries to our
customers.
Our revenues can be affected by the following factors:
• general economic and industry conditions, including inflation, deflation, changes related to the value of the U.S. dollar relative to foreign
currencies, interest rates and rates of economic growth, current and expected unemployment levels and government fiscal and monetary
policies;
• the performance of the financial, equity and credit markets;
• consumer disposable income levels, consumer confidence levels, the availability, cost and level of consumer debt and consumer behaviors
towards incurring and paying debt;
• changes in prices for commodities and energy, including fuel;
• current and expected tax rates and policies;
• changes in the level of consumer spending generally and, specifically, on luxury goods;
• our ability to anticipate, identify and respond effectively to changing consumer demands, fashion trends and consumer shopping preferences
and acquire goods meeting customers’ tastes and preferences;
• changes in the level of full-price sales;
• changes in the level and timing of promotional events conducted;
• changes in the level of delivery and processing revenues collected from our customers;
• our ability to successfully implement our expansion and growth strategies; and
• changes in the composition and the rate of growth of our sales transacted in store and online.
In addition, our revenues are seasonal, as discussed below under “—Seasonality.”
Cost of goods sold including buying and occupancy costs (excluding depreciation). COGS consists of the following components:
• Inventory costs—We utilize the retail inventory method of accounting. Under the retail inventory method, the valuation of inventories at cost
and the resulting gross margins are determined by applying a calculated cost-to-retail ratio, for various groupings of similar items, to the retail
value of our inventories. The cost of the inventory reflected on the Consolidated Financial Statements is decreased by charges to cost of goods
sold at average cost and the retail value of the inventory is lowered through the use of markdowns. Earnings are negatively impacted when
merchandise is marked down. With the introduction of new fashions in the first and third fiscal quarters of each fiscal year and our emphasis on
full-price selling in these quarters, a lower level of markdowns and higher margins are characteristic of these quarters.
• Buying costs—Buying costs consist primarily of salaries and expenses incurred by our merchandising and buying operations.
• Occupancy costs—Occupancy costs consist primarily of rent, property taxes and operating costs of our retail, distribution and support facilities.
A significant portion of our buying and occupancy costs are fixed in nature and are not dependent on the revenues we generate.
• Delivery and processing costs—Delivery and processing costs consist primarily of delivery charges we pay to third party carriers and other costs
related to the fulfillment of customer orders not delivered at the point-of-sale.
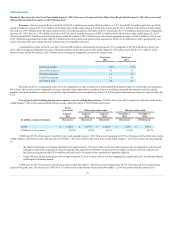
Consistent with industry business practice, we receive allowances from certain of our vendors in support of the merchandise we purchase for resale.
Certain allowances are received to reimburse us for markdowns taken or to support the gross margins that we earn in connection with the sales of the vendor’s
merchandise. These allowances result in an increase to gross margin when we earn the allowances and they are approved by the vendor. Other allowances we
receive represent reductions to the amounts we pay to acquire the merchandise. These allowances reduce the cost of the acquired merchandise and are
recognized at the time the goods are sold. We received vendor allowances of $94.8 million in fiscal year 2015, $88.5 million for the thirty-nine weeks ended
August 2, 2014, $5.0 million for the thirteen weeks ended November 2, 2013 and $90.2 million in fiscal year 2013. The amounts of vendor allowances we
receive fluctuate based on the level of markdowns taken and did not have a significant impact on the year-over-year change in gross margin during fiscal
years 2015, 2014 or 2013.
36