Neiman Marcus 2014 Annual Report Download - page 148
Download and view the complete annual report
Please find page 148 of the 2014 Neiman Marcus annual report below. You can navigate through the pages in the report by either clicking on the pages listed below, or by using the keyword search tool below to find specific information within the annual report.-
 1
1 -
2
-
3
-
4
-
5
-
6
-
7
-
8
-
9
-
10
-
11
-
12
-
13
-
14
-
15
-
16
-
17
-
18
-
19
-
20
-
21
-
22
-
23
-
24
-
25
-
26
-
27
-
28
-
29
-
30
-
31
-
32
-
33
-
34
-
35
-
36
-
37
-
38
-
39
-
40
-
41
-
42
-
43
-
44
-
45
-
46
-
47
-
48
-
49
-
50
-
51
-
52
-
53
-
54
-
55
-
56
-
57
-
58
-
59
-
60
-
61
-
62
-
63
-
64
-
65
-
66
-
67
-
68
-
69
-
70
-
71
-
72
-
73
-
74
-
75
-
76
-
77
-
78
-
79
-
80
-
81
-
82
-
83
-
84
-
85
-
86
-
87
-
88
-
89
-
90
-
91
-
92
-
93
-
94
-
95
-
96
-
97
-
98
-
99
-
100
-
101
-
102
-
103
-
104
-
105
-
106
-
107
-
108
-
109
-
110
-
111
-
112
-
113
-
114
-
115
-
116
-
117
-
118
-
119
-
120
-
121
-
122
-
123
-
124
-
125
-
126
-
127
-
128
-
129
-
130
-
131
-
132
-
133
-
134
-
135
-
136
-
137
-
 138
138 -
 139
139 -
 140
140 -
 141
141 -
 142
142 -
 143
143 -
 144
144 -
 145
145 -
 146
146 -
 147
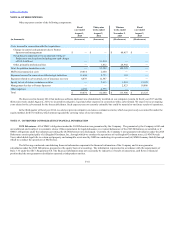
147 -
 148
148 -
 149
149 -
 150
150 -
 151
151 -
 152
152 -
 153
153 -
 154
154 -
 155
155 -
 156
156 -
 157
157 -
 158
158 -
159
-
160
-
161
 |
 |

Table of Contents
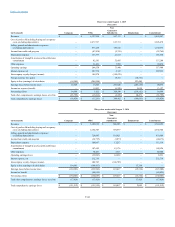
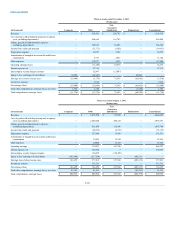
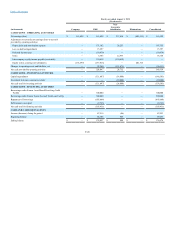
Revenues
$ —
$ 926,436
$ 202,702
$ —
$ 1,129,138
Cost of goods sold including buying and occupancy
costs (excluding depreciation)
—
568,665
116,743
—
685,408
Selling, general and administrative expenses
(excluding depreciation)
—
229,935
36,453
—
266,388
Income from credit card program
—
(13,271)
(1,382)
—
(14,653)
Depreciation expense
—
31,057
3,182
—
34,239
Amortization of intangible assets and favorable lease
commitments
—
8,773
2,947
—
11,720
Other expenses
—
112,377
1,523
—
113,900
Operating earnings (loss)
—
(11,100)
43,236
—
32,136
Interest expense, net
—
37,315
—
—
37,315
Intercompany royalty charges (income)
—
32,907
(32,907)
—
—
Equity in loss (earnings) of subsidiaries
13,098
(76,143)
—
63,045
—
Earnings (loss) before income taxes
(13,098)
(5,179)
76,143
(63,045)
(5,179)
Income tax expense
—
7,919
—
—
7,919
Net earnings (loss)
$ (13,098)
$ (13,098)
$ 76,143
$ (63,045)
$ (13,098)
Total other comprehensive earnings (loss), net of tax
1,324
1,324
—
(1,324)
1,324
Total comprehensive earnings (loss)
$ (11,774)
$ (11,774)
$ 76,143
$ (64,369)
$ (11,774)
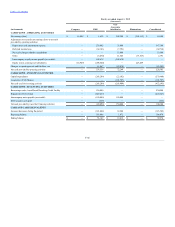
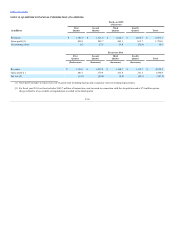
Revenues
$ —
$ 3,875,580
$ 772,669
$ —
$ 4,648,249
Cost of goods sold including buying and occupancy
costs (excluding depreciation)
—
2,500,640
494,723
—
2,995,363
Selling, general and administrative expenses
(excluding depreciation)
—
911,850
135,946
—
1,047,796
Income from credit card program
—
(48,635)
(4,738)
—
(53,373)
Depreciation expense
—
127,606
13,909
—
141,515
Amortization of intangible assets and favorable lease
commitments
—
35,092
12,344
—
47,436
Other expenses
—
10,000
13,125
—
23,125
Operating earnings
—
339,027
107,360
—
446,387
Interest expense, net
—
168,952
3
—
168,955
Intercompany royalty charges (income)
—
130,459
(130,459)
—
—
Equity in loss (earnings) of subsidiaries
(163,699)
(237,816)
—
401,515
—
Earnings (loss) before income taxes
163,699
277,432
237,816
(401,515)
277,432
Income tax expense
—
113,733
—
—
113,733
Net earnings (loss)
$ 163,699
$ 163,699
$ 237,816
$ (401,515)
$ 163,699
Total other comprehensive earnings (loss), net of tax
41,263
41,263
—
(41,263)
41,263
Total comprehensive earnings (loss)
$ 204,962
$ 204,962
$ 237,816
$ (442,778)
$ 204,962
F-45