Neiman Marcus 2014 Annual Report Download - page 34
Download and view the complete annual report
Please find page 34 of the 2014 Neiman Marcus annual report below. You can navigate through the pages in the report by either clicking on the pages listed below, or by using the keyword search tool below to find specific information within the annual report.-
 1
1 -
2
-
3
-
4
-
5
-
6
-
7
-
8
-
9
-
10
-
11
-
12
-
13
-
14
-
15
-
16
-
17
-
18
-
19
-
20
-
21
-
22
-
23
-
 24
24 -
 25
25 -
 26
26 -
 27
27 -
 28
28 -
 29
29 -
 30
30 -
 31
31 -
 32
32 -
 33
33 -
 34
34 -
 35
35 -
 36
36 -
 37
37 -
 38
38 -
 39
39 -
 40
40 -
 41
41 -
 42
42 -
 43
43 -
 44
44 -
45
-
46
-
47
-
48
-
49
-
50
-
51
-
52
-
53
-
54
-
55
-
56
-
57
-
58
-
59
-
60
-
61
-
62
-
63
-
64
-
65
-
66
-
67
-
68
-
69
-
70
-
71
-
72
-
73
-
74
-
75
-
76
-
77
-
78
-
79
-
80
-
81
-
82
-
83
-
84
-
85
-
86
-
87
-
88
-
89
-
90
-
91
-
92
-
93
-
94
-
95
-
96
-
97
-
98
-
99
-
100
-
101
-
102
-
103
-
104
-
105
-
106
-
107
-
108
-
109
-
110
-
111
-
112
-
113
-
114
-
115
-
116
-
117
-
118
-
119
-
120
-
121
-
122
-
123
-
124
-
125
-
126
-
127
-
128
-
129
-
130
-
131
-
132
-
133
-
134
-
135
-
136
-
137
-
138
-
139
-
140
-
141
-
142
-
143
-
144
-
145
-
146
-
147
-
148
-
149
-
150
-
151
-
152
-
153
-
154
-
155
-
156
-
157
-
158
-
159
-
160
-
161
 |
 |

Table of Contents
In connection with the Acquisition, the Company incurred substantial new indebtedness, in part in replacement of former indebtedness. See
“Liquidity and Capital Resources.” In addition, the purchase price paid in connection with the Acquisition has been allocated to state the acquired assets
and liabilities at fair value. The purchase accounting adjustments increased the carrying value of our property and equipment and inventory, revalued our
intangible assets related to our tradenames, customer lists and favorable lease commitments and revalued our long-term benefit plan obligations, among other
things. As a result, our Successor financial statements subsequent to the Acquisition are not necessarily comparable to our Predecessor financial statements.
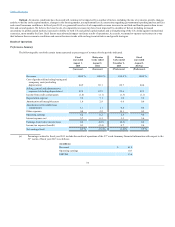
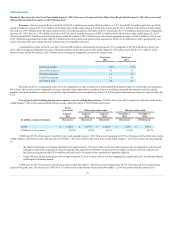
A summary of our results of operations is as follows:
- Our revenues for fiscal year 2015 were $5,095.1 million, an increase of 5.3% from $4,839.3 million in fiscal year 2014, which
included revenues of $3,710.2 million in the thirty-nine weeks ended August 2, 2014 (Successor) and $1,129.1 million in the thirteen weeks
ended November 2, 2013 (Predecessor). Revenues generated by our online operations were $1,338.4 million in fiscal year 2015, a comparable
increase of 13.0% from fiscal year 2014. MyTheresa generated revenues of $122.7 million in the thirty-nine week period since acquisition,
which are included in revenues generated by our online operations but are excluded from all calculations of comparable revenues.
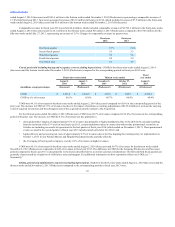
- COGS were 65.9% of revenues for the thirty-nine
weeks ended August 1, 2015 (Successor) compared to 69.1% of revenues for the thirty-nine weeks ended August 2, 2014 (Successor). The
decrease in COGS was due primarily to the impact of purchase accounting adjustments in fiscal year 2014 to increase the carrying value of
acquired inventories and subsequent sale of the acquired inventories.
COGS were 61.4% of revenues for the thirteen weeks ended November 1, 2014 (Successor) compared to 60.7% of revenues in the corresponding
period of the prior year. The increase in COGS was due primarily to (i) higher delivery and processing net costs due to our free shipping/free
returns policy for our Neiman Marcus and Bergdorf Goodman brands and (ii) higher buying and occupancy costs as a result of non-cash
purchase accounting adjustments to increase our lease rentals to estimated market rates at the Acquisition date and higher rental rates incurred
in connection with the expansion of our small format stores.
At August 1, 2015, on-hand inventories totaled $1,154.8 million, an 8.0% increase from August 2, 2014. Based on our current inventory
position, we will continue to closely monitor and align our inventory levels and purchases with anticipated customer demand.
- SG&A expenses were 22.4% of revenues in the thirty-nine
weeks ended August 1, 2015 (Successor) compared to 22.5% of revenues in the corresponding period of the prior year. The lower level of SG&A
expenses, as a percentage of revenues, is due primarily to (i) lower current and long-term incentive compensation costs, partially offset by (ii)
higher expenses driven by the recent expansion of our small format stores, the remodels of our full-line stores and the acquisition of MyTheresa.
SG&A represented 24.1% of revenues in the thirteen weeks ended November 1, 2014 (Successor) compared to 23.6% of revenues in the
corresponding period of the prior year. The higher level of SG&A expenses, as a percentage of revenues, primarily reflects (i) higher planned
investments and initiative costs associated with our ongoing investments in corporate initiatives and pre-opening costs incurred in connection
with the opening of three small format stores in the thirteen weeks ended November 1, 2014, (ii) higher selling costs driven in part by the
expansion of our small format stores and (iii) higher current incentive compensation costs.
- Net cash provided by our operating activities was $228.4 million in fiscal year 2015 compared to $283.4 million in the Acquisition and
thirty-nine weeks ended August 2, 2014 (Successor) and $12.3 million in the thirteen weeks ended November 2, 2013 (Predecessor). We held cash balances of
$73.0 million at August 1, 2015 compared to $196.5 million at August 2, 2014. At August 1, 2015, we had $130.0 million borrowings outstanding under the
Asset-Based Revolving Credit Facility, no outstanding letters of credit and $680.0 million of unused borrowing availability. We believe that cash generated
from our operations along with our cash balances and available sources of financing will enable us to meet our anticipated cash obligations during the next
twelve months.
33