Neiman Marcus 2014 Annual Report Download - page 121
Download and view the complete annual report
Please find page 121 of the 2014 Neiman Marcus annual report below. You can navigate through the pages in the report by either clicking on the pages listed below, or by using the keyword search tool below to find specific information within the annual report.-
 1
1 -
2
-
3
-
4
-
5
-
6
-
7
-
8
-
9
-
10
-
11
-
12
-
13
-
14
-
15
-
16
-
17
-
18
-
19
-
20
-
21
-
22
-
23
-
24
-
25
-
26
-
27
-
28
-
29
-
30
-
31
-
32
-
33
-
34
-
35
-
36
-
37
-
38
-
39
-
40
-
41
-
42
-
43
-
44
-
45
-
46
-
47
-
48
-
49
-
50
-
51
-
52
-
53
-
54
-
55
-
56
-
57
-
58
-
59
-
60
-
61
-
62
-
63
-
64
-
65
-
66
-
67
-
68
-
69
-
70
-
71
-
72
-
73
-
74
-
75
-
76
-
77
-
78
-
79
-
80
-
81
-
82
-
83
-
84
-
85
-
86
-
87
-
88
-
89
-
90
-
91
-
92
-
93
-
94
-
95
-
96
-
97
-
98
-
99
-
100
-
101
-
102
-
103
-
104
-
105
-
106
-
107
-
108
-
109
-
110
-
 111
111 -
 112
112 -
 113
113 -
 114
114 -
 115
115 -
 116
116 -
 117
117 -
 118
118 -
 119
119 -
 120
120 -
 121
121 -
 122
122 -
 123
123 -
 124
124 -
 125
125 -
 126
126 -
 127
127 -
 128
128 -
 129
129 -
 130
130 -
 131
131 -
132
-
133
-
134
-
135
-
136
-
137
-
138
-
139
-
140
-
141
-
142
-
143
-
144
-
145
-
146
-
147
-
148
-
149
-
150
-
151
-
152
-
153
-
154
-
155
-
156
-
157
-
158
-
159
-
160
-
161
 |
 |

Table of Contents
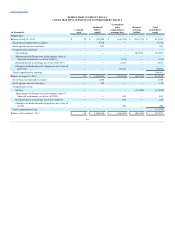
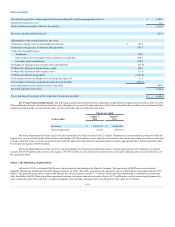
Customer lists
$ 18.8
Tradenames
74.8
Goodwill
140.0
Contingent earn-out obligation
50.0
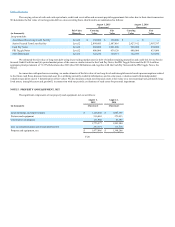
MyTheresa results of operations are included in our consolidated results of operations effective as of the beginning of the second quarter of fiscal
year 2015.
Fair value is the price that would be received upon sale of an asset or paid upon transfer of a liability in an orderly transaction between market
participants at the measurement date and in the principal or most advantageous market for that asset or liability. Assets and liabilities are classified using a
fair value hierarchy that prioritizes the inputs to valuation techniques used to measure fair value as follows:
• Level 1 — Unadjusted quoted prices for identical instruments traded in active markets.
• Level 2 — Observable market-based inputs or unobservable inputs corroborated by market data.
• Level 3 — Unobservable inputs reflecting management’s estimates and assumptions.
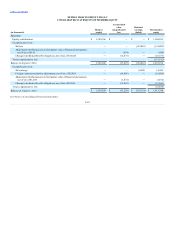
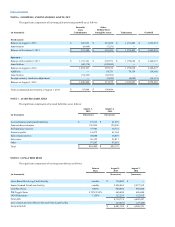
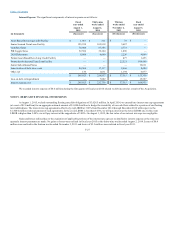
The following table shows the Company’s financial assets that are required to be measured at fair value on a recurring basis in our Consolidated
Balance Sheets:
Other long-term assets:
Interest rate caps
Level 2
$ 21
$ 1,132
Other long-term liabilities:
Contingent earn-out obligation
Level 3
$ 51,251
$ —
The fair value of the interest rate caps are estimated using industry standard valuation models using market-based observable inputs, including
interest rate curves. In addition, the fair value of the interest rate caps includes consideration of the counterparty’s non-performance risk.
The fair value of the contingent earn-out obligation incurred in connection with the acquisition of MyTheresa was estimated as of the acquisition
date using a valuation model that measured the present value of the probable cash payments based upon the forecasted operating performance of MyTheresa
and a discount rate that captures the risk associated with the obligation. We update our assumptions based on new developments and adjust the carrying
value of the obligation to its estimated fair value at each reporting date.
F-19