Neiman Marcus 2014 Annual Report Download - page 42
Download and view the complete annual report
Please find page 42 of the 2014 Neiman Marcus annual report below. You can navigate through the pages in the report by either clicking on the pages listed below, or by using the keyword search tool below to find specific information within the annual report.-
 1
1 -
2
-
3
-
4
-
5
-
6
-
7
-
8
-
9
-
10
-
11
-
12
-
13
-
14
-
15
-
16
-
17
-
18
-
19
-
20
-
21
-
22
-
23
-
24
-
25
-
26
-
27
-
28
-
29
-
30
-
31
-
 32
32 -
 33
33 -
 34
34 -
 35
35 -
 36
36 -
 37
37 -
 38
38 -
 39
39 -
 40
40 -
 41
41 -
 42
42 -
 43
43 -
 44
44 -
 45
45 -
 46
46 -
 47
47 -
 48
48 -
 49
49 -
 50
50 -
 51
51 -
 52
52 -
53
-
54
-
55
-
56
-
57
-
58
-
59
-
60
-
61
-
62
-
63
-
64
-
65
-
66
-
67
-
68
-
69
-
70
-
71
-
72
-
73
-
74
-
75
-
76
-
77
-
78
-
79
-
80
-
81
-
82
-
83
-
84
-
85
-
86
-
87
-
88
-
89
-
90
-
91
-
92
-
93
-
94
-
95
-
96
-
97
-
98
-
99
-
100
-
101
-
102
-
103
-
104
-
105
-
106
-
107
-
108
-
109
-
110
-
111
-
112
-
113
-
114
-
115
-
116
-
117
-
118
-
119
-
120
-
121
-
122
-
123
-
124
-
125
-
126
-
127
-
128
-
129
-
130
-
131
-
132
-
133
-
134
-
135
-
136
-
137
-
138
-
139
-
140
-
141
-
142
-
143
-
144
-
145
-
146
-
147
-
148
-
149
-
150
-
151
-
152
-
153
-
154
-
155
-
156
-
157
-
158
-
159
-
160
-
161
 |
 |

Table of Contents
expense in fiscal year 2015 was due primarily to (i) higher asset values attributable to fair value adjustments to our assets recorded in connection with the
purchase price allocation to reflect the Acquisition and (ii) higher capital spending.
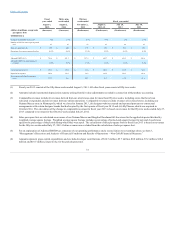
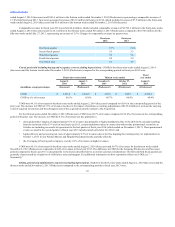
Amortization expense was $137.3 million, or 2.7% of revenues, in fiscal year 2015 compared to $148.6 million, or 4.0% of revenues, in the thirty-
nine weeks ended August 2, 2014 (Successor) and $11.7 million, or 1.0% of revenues, in the thirteen weeks ended November 2, 2013 (Predecessor). The
decrease in amortization expense of 1.3% of revenues in fiscal year 2015 compared to the thirty-nine weeks ended August 2, 2014 (Successor) was due
primarily to lower amortization charges with respect to our customer lists in fiscal year 2015. The increase in amortization expense of 1.7% of revenues in
fiscal year 2015 compared to the thirteen weeks ended November 2, 2013 (Predecessor) was due primarily to higher asset values attributable to fair value
adjustments to our assets recorded in connection with the purchase price allocation to reflect the Acquisition.
Other expenses. Other expenses in fiscal year 2015 were $39.5 million, or 0.8% of revenues, compared to $82.1 million, or 2.2% of revenues, in the
thirty-nine weeks ended August 2, 2014 (Successor) and $113.9 million, or 10.1% of revenues, in the thirteen weeks ended November 2, 2013 (Predecessor).
Other expenses include (i) costs incurred in connection with the Acquisition and the MyTheresa acquisition, (ii) expenses incurred in connection with
strategic initiatives, (iii) investigative, legal and other expenses, net of insurance recovery, incurred in connection with the Cyber-Attack discovered in
January 2014 and (iv) other expenses. We expect to incur ongoing costs related to the Cyber-Attack for the foreseeable future. Such costs are not currently
estimable but could be material to our future results of operations.
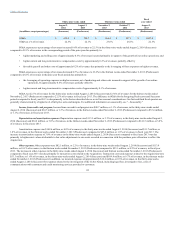
Operating earnings. We generated operating earnings of $318.0 million, or 6.2% of revenues, in fiscal year 2015 compared to operating earnings of
$8.8 million, or 0.2% of revenues, in the thirty-nine weeks ended August 2, 2014 (Successor) and $32.1 million, or 2.8% of revenues, in the thirteen weeks
ended November 2, 2013 (Predecessor). Included in operating earnings in fiscal year 2015 were:
• other expenses of $39.5 million; and
• impact of purchase accounting adjustments that increased COGS by $6.8 million related to the step-up in the carrying value of the acquired
MyTheresa inventories.
Included in operating earnings in fiscal year 2014 were:
• other expenses of $82.1 million in the thirty-nine weeks ended August 2, 2014 (Successor) and $113.9 million in the thirteen weeks ended
November 2, 2013 (Predecessor); and
• impact of purchase accounting adjustments that increased COGS by $129.6 million in the thirty-nine weeks ended August 2, 2014 (Successor)
related to the step-up in the carrying value of the inventories acquired in connection with the Acquisition.
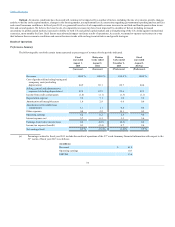
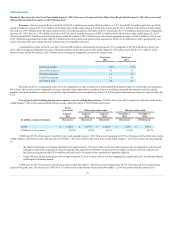
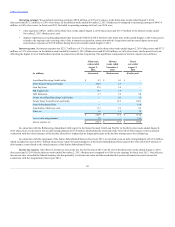
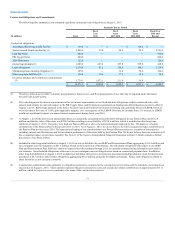
Interest expense. Net interest expense was $289.9 million, or 5.7% of revenues, in fiscal year 2015 and $232.7 million, or 6.3% of revenues, in the
thirty-nine weeks ended August 2, 2014 (Successor) and $37.3 million, or 3.3% of revenues, in the thirteen weeks ended November 2, 2013 (Predecessor).
The significant components of interest expense are as follows:
41