Neiman Marcus 2014 Annual Report Download - page 68
Download and view the complete annual report
Please find page 68 of the 2014 Neiman Marcus annual report below. You can navigate through the pages in the report by either clicking on the pages listed below, or by using the keyword search tool below to find specific information within the annual report.-
 1
1 -
2
-
3
-
4
-
5
-
6
-
7
-
8
-
9
-
10
-
11
-
12
-
13
-
14
-
15
-
16
-
17
-
18
-
19
-
20
-
21
-
22
-
23
-
24
-
25
-
26
-
27
-
28
-
29
-
30
-
31
-
32
-
33
-
34
-
35
-
36
-
37
-
38
-
39
-
40
-
41
-
42
-
43
-
44
-
45
-
46
-
47
-
48
-
49
-
50
-
51
-
52
-
53
-
54
-
55
-
56
-
57
-
 58
58 -
 59
59 -
 60
60 -
 61
61 -
 62
62 -
 63
63 -
 64
64 -
 65
65 -
 66
66 -
 67
67 -
 68
68 -
 69
69 -
 70
70 -
 71
71 -
 72
72 -
 73
73 -
 74
74 -
 75
75 -
 76
76 -
 77
77 -
 78
78 -
79
-
80
-
81
-
82
-
83
-
84
-
85
-
86
-
87
-
88
-
89
-
90
-
91
-
92
-
93
-
94
-
95
-
96
-
97
-
98
-
99
-
100
-
101
-
102
-
103
-
104
-
105
-
106
-
107
-
108
-
109
-
110
-
111
-
112
-
113
-
114
-
115
-
116
-
117
-
118
-
119
-
120
-
121
-
122
-
123
-
124
-
125
-
126
-
127
-
128
-
129
-
130
-
131
-
132
-
133
-
134
-
135
-
136
-
137
-
138
-
139
-
140
-
141
-
142
-
143
-
144
-
145
-
146
-
147
-
148
-
149
-
150
-
151
-
152
-
153
-
154
-
155
-
156
-
157
-
158
-
159
-
160
-
161
 |
 |

Table of Contents
Company for their services in fiscal year 2015 did not exceed $120,000 in either case. Neither Hay Group nor Haigh and Company has other affiliations with,
or provides other services to, us.
Ultimately, our named executive officers’ total compensation is based on the level of performance of the Company and/or the Company’s applicable
business unit or division. The Compensation Committee uses its discretion in making decisions on the overall compensation packages of our executive
officers based on current market conditions, business trends and overall Company performance.
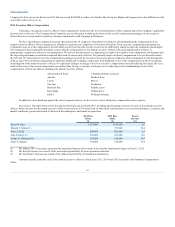
We have identified an industry peer group that includes the 14 companies listed below for purposes of benchmarking the compensation of our
named executive officers. These companies are intended to represent our competitors for business and talent. Their executive compensation programs are
compared to ours, as is the compensation of individual executives if the jobs of such executives are sufficiently similar to make the comparison meaningful.
The comparison data is generally intended to ensure that the compensation of our named executive officers, both individually and as a whole, is
appropriately competitive relative to our performance. We believe that this practice is appropriate in light of the high level of commitment, job demands and
the expected performance contribution required from each of our executive officers. We generally target our direct compensation to be positioned between
the 50th and 75th percentile levels of the compensation packages received by executives in our peer group of industry related companies. In the third quarter
of fiscal year 2014, our former compensation consultant, Haigh and Company, conducted a benchmarking review of the compensation of all of our officers,
including that of the named executive officers. No significant changes in design or levels of executive compensation were made during fiscal year 2015 as a
result of the review. Our current compensation consultant, Hay Group, is currently in the process of conducting a new benchmarking review of the
compensation of all of our officers, including the named executive officers.
Abercrombie & Fitch L Brands (formerly Limited)
Ann Inc. Michael Kors
Coach Macy's
The Gap Nordstrom
Hudson's Bay Ralph Lauren
Kate Spade Tiffany & Co.
Kohl’s Williams-Sonoma
In addition to benchmarking against the select companies above, we also review various third party compensation survey reports.
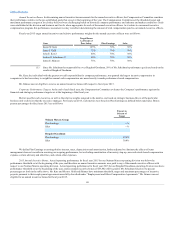
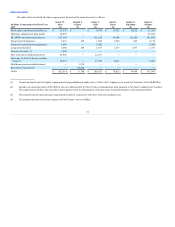
Base Salary. The table below shows the salaries for fiscal years 2014 and 2015, including the percentage increase, for each of the named executive
officers. Salary increase for the named executive officers in fiscal year 2015 were based on individual contributions to our overall performance, economic and
market conditions, general movement of salaries in the marketplace and results of operations.
Karen W. Katz 1,070,000
1,100,000
2.8
Donald T. Grimes (1) —
725,000
N/A
James J. Gold 800,000
820,000
2.5
John E. Koryl (2) 550,000
625,000
13.6
Joshua G. Schulman (3) 510,000
610,000
19.6
James E. Skinner 750,000
750,000
N/A
(1) Mr. Grimes' 2015 base salary represents the annualized amount of his salary at the time his employment began on June 15, 2015.
(2) Mr. Koryl's increase was a result of his increased responsibility for store operations and sales.
(3) Mr. Schulman’s increase was a result of the added responsibility of international operations.
Amounts actually earned by each of the named executive officers in fiscal years 2013, 2014 and 2015 are listed in the Summary Compensation
Table.
67