Neiman Marcus 2014 Annual Report Download - page 150
Download and view the complete annual report
Please find page 150 of the 2014 Neiman Marcus annual report below. You can navigate through the pages in the report by either clicking on the pages listed below, or by using the keyword search tool below to find specific information within the annual report.-
 1
1 -
2
-
3
-
4
-
5
-
6
-
7
-
8
-
9
-
10
-
11
-
12
-
13
-
14
-
15
-
16
-
17
-
18
-
19
-
20
-
21
-
22
-
23
-
24
-
25
-
26
-
27
-
28
-
29
-
30
-
31
-
32
-
33
-
34
-
35
-
36
-
37
-
38
-
39
-
40
-
41
-
42
-
43
-
44
-
45
-
46
-
47
-
48
-
49
-
50
-
51
-
52
-
53
-
54
-
55
-
56
-
57
-
58
-
59
-
60
-
61
-
62
-
63
-
64
-
65
-
66
-
67
-
68
-
69
-
70
-
71
-
72
-
73
-
74
-
75
-
76
-
77
-
78
-
79
-
80
-
81
-
82
-
83
-
84
-
85
-
86
-
87
-
88
-
89
-
90
-
91
-
92
-
93
-
94
-
95
-
96
-
97
-
98
-
99
-
100
-
101
-
102
-
103
-
104
-
105
-
106
-
107
-
108
-
109
-
110
-
111
-
112
-
113
-
114
-
115
-
116
-
117
-
118
-
119
-
120
-
121
-
122
-
123
-
124
-
125
-
126
-
127
-
128
-
129
-
130
-
131
-
132
-
133
-
134
-
135
-
136
-
137
-
138
-
139
-
 140
140 -
 141
141 -
 142
142 -
 143
143 -
 144
144 -
 145
145 -
 146
146 -
 147
147 -
 148
148 -
 149
149 -
 150
150 -
 151
151 -
 152
152 -
 153
153 -
 154
154 -
 155
155 -
 156
156 -
 157
157 -
 158
158 -
 159
159 -
 160
160 -
161
 |
 |
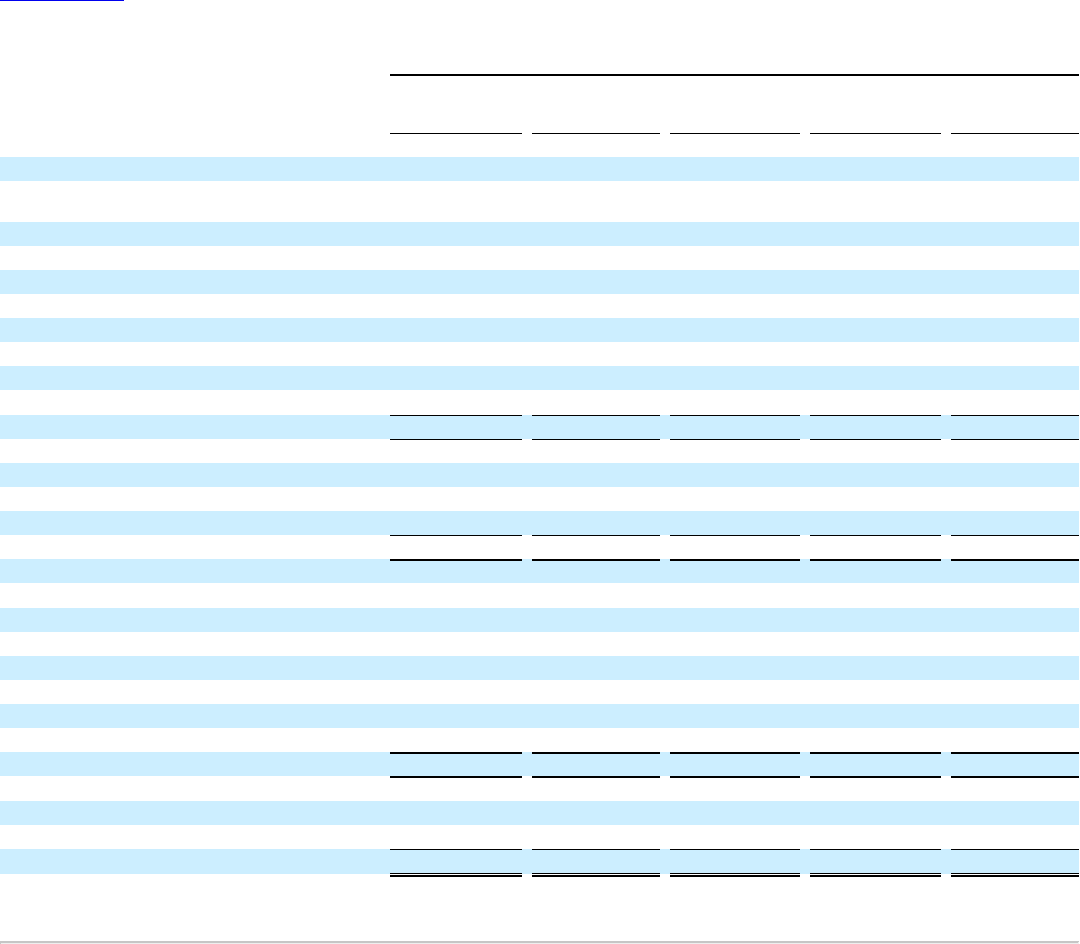
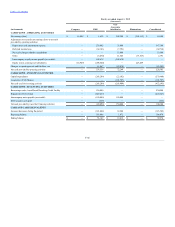
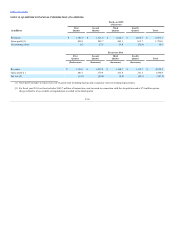
Table of Contents
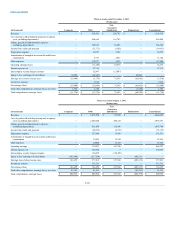
Net earnings (loss)
$ (134,083)
$ (134,083)
$ 149,417
$ (15,334)
$ (134,083)
Adjustments to reconcile net earnings (loss) to net cash
provided by (used for) operating activities:
Depreciation and amortization expense
—
224,664
54,413
—
279,077
Loss on debt extinguishment
—
7,882
—
—
7,882
Deferred income taxes
—
(117,874)
—
—
(117,874)
Non-cash charges related to the Acquisition
—
145,062
—
—
145,062
Other
—
4,878
3,666
—
8,544
Intercompany royalty income payable (receivable)
—
106,783
(106,783)
—
—
Equity in loss (earnings) of subsidiaries
134,083
(149,417)
—
15,334
—
Changes in operating assets and liabilities, net
—
216,411
(121,634)
—
94,777
Net cash provided by (used for) operating activities
—
304,306
(20,921)
—
283,385
Capital expenditures
—
(124,321)
(13,686)
—
(138,007)
Acquisition of Neiman Marcus Group LTD LLC
—
(3,388,585)
—
—
(3,388,585)
Investment in Asian e-commerce retailer
—
—
35,000
—
35,000
Net cash provided by (used for) investing activities
—
(3,512,906)
21,314
—
(3,491,592)
Borrowings under Asset-Based Revolving Credit Facility
—
170,000
—
—
170,000
Borrowings under Senior Secured Term Loan Facility
—
2,950,000
—
—
2,950,000
Borrowings under Cash Pay Notes
—
960,000
—
—
960,000
Borrowings under PIK Toggle Notes
—
600,000
—
—
600,000
Repayment of borrowings
—
(2,770,185)
—
—
(2,770,185)
Debt issuance costs paid
—
(178,606)
—
—
(178,606)
Cash equity contributions
—
1,557,350
—
—
1,557,350
Net cash provided by financing activities
—
3,288,559
—
—
3,288,559
Increase during the period
—
79,959
393
—
80,352
Beginning balance
—
115,045
1,079
—
116,124
Ending balance
$ —
$ 195,004
$ 1,472
$ —
$ 196,476
F-47