Neiman Marcus 2014 Annual Report Download - page 153
Download and view the complete annual report
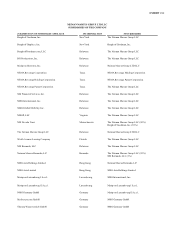
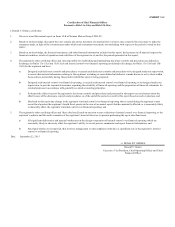
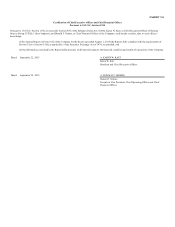
Please find page 153 of the 2014 Neiman Marcus annual report below. You can navigate through the pages in the report by either clicking on the pages listed below, or by using the keyword search tool below to find specific information within the annual report.-
 1
1 -
2
-
3
-
4
-
5
-
6
-
7
-
8
-
9
-
10
-
11
-
12
-
13
-
14
-
15
-
16
-
17
-
18
-
19
-
20
-
21
-
22
-
23
-
24
-
25
-
26
-
27
-
28
-
29
-
30
-
31
-
32
-
33
-
34
-
35
-
36
-
37
-
38
-
39
-
40
-
41
-
42
-
43
-
44
-
45
-
46
-
47
-
48
-
49
-
50
-
51
-
52
-
53
-
54
-
55
-
56
-
57
-
58
-
59
-
60
-
61
-
62
-
63
-
64
-
65
-
66
-
67
-
68
-
69
-
70
-
71
-
72
-
73
-
74
-
75
-
76
-
77
-
78
-
79
-
80
-
81
-
82
-
83
-
84
-
85
-
86
-
87
-
88
-
89
-
90
-
91
-
92
-
93
-
94
-
95
-
96
-
97
-
98
-
99
-
100
-
101
-
102
-
103
-
104
-
105
-
106
-
107
-
108
-
109
-
110
-
111
-
112
-
113
-
114
-
115
-
116
-
117
-
118
-
119
-
120
-
121
-
122
-
123
-
124
-
125
-
126
-
127
-
128
-
129
-
130
-
131
-
132
-
133
-
134
-
135
-
136
-
137
-
138
-
139
-
140
-
141
-
142
-
 143
143 -
 144
144 -
 145
145 -
 146
146 -
 147
147 -
 148
148 -
 149
149 -
 150
150 -
 151
151 -
 152
152 -
 153
153 -
 154
154 -
 155
155 -
 156
156 -
 157
157 -
 158
158 -
 159
159 -
 160
160 -
 161
161
 |
 |

Table of Contents
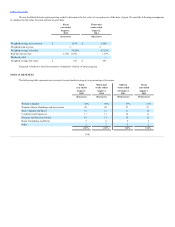
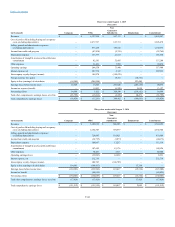
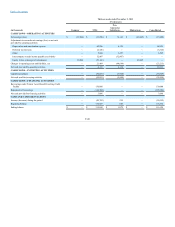
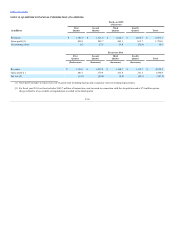
Revenues
$ 1,186.5
$ 1,521.8
$ 1,220.1
$ 1,166.7
$ 5,095.1
Gross profit (1)
458.1
502.7
465.1
363.7
1,789.6
Net earnings (loss)
0.2
27.8
19.8
(32.9)
14.9
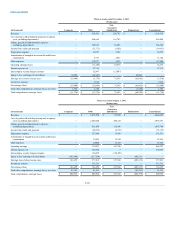
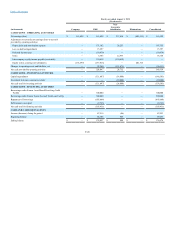
Revenues
$ 1,129.1
$ 1,432.8
$ 1,164.7
$ 1,112.7
$ 4,839.3
Gross profit (1)
443.7
379.9
415.8
351.5
1,590.9
Net loss (2)
(13.1)
(84.0)
(8.0)
(42.1)
(147.2)
(1) Gross profit includes revenues less cost of goods sold including buying and occupancy costs (excluding depreciation).
(2) For fiscal year 2014, net loss includes $162.7 million of transaction costs incurred in connection with the Acquisition and a $7.9 million pretax
charge related to a loss on debt extinguishment recorded in the third quarter.
F-50