Neiman Marcus 2014 Annual Report Download - page 38
Download and view the complete annual report
Please find page 38 of the 2014 Neiman Marcus annual report below. You can navigate through the pages in the report by either clicking on the pages listed below, or by using the keyword search tool below to find specific information within the annual report.-
 1
1 -
2
-
3
-
4
-
5
-
6
-
7
-
8
-
9
-
10
-
11
-
12
-
13
-
14
-
15
-
16
-
17
-
18
-
19
-
20
-
21
-
22
-
23
-
24
-
25
-
26
-
27
-
 28
28 -
 29
29 -
 30
30 -
 31
31 -
 32
32 -
 33
33 -
 34
34 -
 35
35 -
 36
36 -
 37
37 -
 38
38 -
 39
39 -
 40
40 -
 41
41 -
 42
42 -
 43
43 -
 44
44 -
 45
45 -
 46
46 -
 47
47 -
 48
48 -
49
-
50
-
51
-
52
-
53
-
54
-
55
-
56
-
57
-
58
-
59
-
60
-
61
-
62
-
63
-
64
-
65
-
66
-
67
-
68
-
69
-
70
-
71
-
72
-
73
-
74
-
75
-
76
-
77
-
78
-
79
-
80
-
81
-
82
-
83
-
84
-
85
-
86
-
87
-
88
-
89
-
90
-
91
-
92
-
93
-
94
-
95
-
96
-
97
-
98
-
99
-
100
-
101
-
102
-
103
-
104
-
105
-
106
-
107
-
108
-
109
-
110
-
111
-
112
-
113
-
114
-
115
-
116
-
117
-
118
-
119
-
120
-
121
-
122
-
123
-
124
-
125
-
126
-
127
-
128
-
129
-
130
-
131
-
132
-
133
-
134
-
135
-
136
-
137
-
138
-
139
-
140
-
141
-
142
-
143
-
144
-
145
-
146
-
147
-
148
-
149
-
150
-
151
-
152
-
153
-
154
-
155
-
156
-
157
-
158
-
159
-
160
-
161
 |
 |

Table of Contents
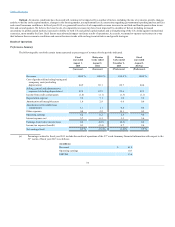
Changes in our COGS as a percentage of revenues can be affected by the following factors:
• our ability to order an appropriate amount of merchandise to match customer demand and the related impact on the level of net markdowns and
promotions costs incurred;
• customer acceptance of and demand for the merchandise we offer in a given season and the related impact of such factors on the level of full-
price sales;
• factors affecting revenues generally, including pricing and promotional strategies, product offerings and actions taken by competitors;
• changes in delivery and processing costs and our ability to pass such costs on to our customers;
• changes in occupancy costs primarily associated with the opening of new stores or distribution facilities; and
• the amount of vendor reimbursements we receive during the reporting period.
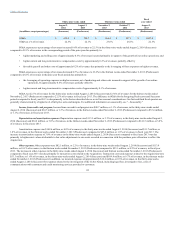
Selling, general and administrative expenses (excluding depreciation). SG&A principally consists of costs related to employee compensation and
benefits in the selling and administrative support areas and advertising and marketing costs. A significant portion of our SG&A expenses is variable in nature
and is dependent on the revenues we generate.
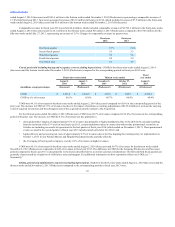
Advertising costs consist primarily of (i) online marketing costs, (ii) advertising costs incurred related to the production of the photographic content
for our websites and (iii) costs incurred related to the production, printing and distribution of our print catalogs and other promotional materials mailed to our
customers. We receive advertising allowances from certain of our merchandise vendors. Substantially all the advertising allowances we receive represent
reimbursements of direct, specific and incremental costs that we incur to promote the vendor’s merchandise in connection with our various advertising
programs, primarily catalogs and other print media. Advertising allowances fluctuate based on the level of advertising expenses incurred and are recorded as
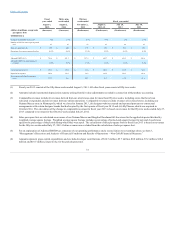
a reduction of our advertising costs when earned. Advertising allowances were approximately $55.0 million in fiscal year 2015, $31.4 million for the thirty-
nine weeks ended August 2, 2014, $20.0 million for the thirteen weeks ended November 2, 2013 and $55.0 million in fiscal year 2013.
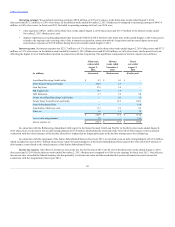
We also receive allowances from certain merchandise vendors in connection with compensation programs for employees who sell the vendor’s
merchandise. These allowances are netted against the related compensation expenses that we incur. Amounts received from vendors related to compensation
programs were $76.4 million in fiscal year 2015, $55.4 million for the thirty-nine weeks ended August 2, 2014, $18.5 million for the thirteen weeks ended
November 2, 2013 and $72.2 million in fiscal year 2013.
Changes in our SG&A expenses are affected primarily by the following factors:
• changes in the level of our revenues;
• changes in the number of sales associates, which are due primarily to new store openings and expansion of existing stores, and the health care
and related benefits expenses incurred as a result of such changes;
• changes in expenses incurred in connection with our advertising and marketing programs; and
• changes in expenses related to employee benefits due to general economic conditions such as rising health care costs.
Income from credit card program. We maintain a proprietary credit card program through which credit is extended to customers and have a related
marketing and servicing alliance with affiliates of Capital One. Pursuant to the Program Agreement, Capital One currently offers credit cards and non-card
payment plans under both the "Neiman Marcus" and "Bergdorf Goodman" brand names.
We receive payments from Capital One based on sales transacted on our proprietary credit cards. We recognize income from our credit card program
when earned. In the future, the income from our credit card program may:
• increase or decrease based upon the level of utilization of our proprietary credit cards by our customers;
• increase or decrease based upon the overall profitability and performance of the credit card portfolio due to the level of bad debts incurred or
changes in interest rates, among other factors;
37