Neiman Marcus 2014 Annual Report Download - page 147
Download and view the complete annual report
Please find page 147 of the 2014 Neiman Marcus annual report below. You can navigate through the pages in the report by either clicking on the pages listed below, or by using the keyword search tool below to find specific information within the annual report.-
 1
1 -
2
-
3
-
4
-
5
-
6
-
7
-
8
-
9
-
10
-
11
-
12
-
13
-
14
-
15
-
16
-
17
-
18
-
19
-
20
-
21
-
22
-
23
-
24
-
25
-
26
-
27
-
28
-
29
-
30
-
31
-
32
-
33
-
34
-
35
-
36
-
37
-
38
-
39
-
40
-
41
-
42
-
43
-
44
-
45
-
46
-
47
-
48
-
49
-
50
-
51
-
52
-
53
-
54
-
55
-
56
-
57
-
58
-
59
-
60
-
61
-
62
-
63
-
64
-
65
-
66
-
67
-
68
-
69
-
70
-
71
-
72
-
73
-
74
-
75
-
76
-
77
-
78
-
79
-
80
-
81
-
82
-
83
-
84
-
85
-
86
-
87
-
88
-
89
-
90
-
91
-
92
-
93
-
94
-
95
-
96
-
97
-
98
-
99
-
100
-
101
-
102
-
103
-
104
-
105
-
106
-
107
-
108
-
109
-
110
-
111
-
112
-
113
-
114
-
115
-
116
-
117
-
118
-
119
-
120
-
121
-
122
-
123
-
124
-
125
-
126
-
127
-
128
-
129
-
130
-
131
-
132
-
133
-
134
-
135
-
136
-
 137
137 -
 138
138 -
 139
139 -
 140
140 -
 141
141 -
 142
142 -
 143
143 -
 144
144 -
 145
145 -
 146
146 -
 147
147 -
 148
148 -
 149
149 -
 150
150 -
 151
151 -
 152
152 -
 153
153 -
 154
154 -
 155
155 -
 156
156 -
 157
157 -
158
-
159
-
160
-
161
 |
 |
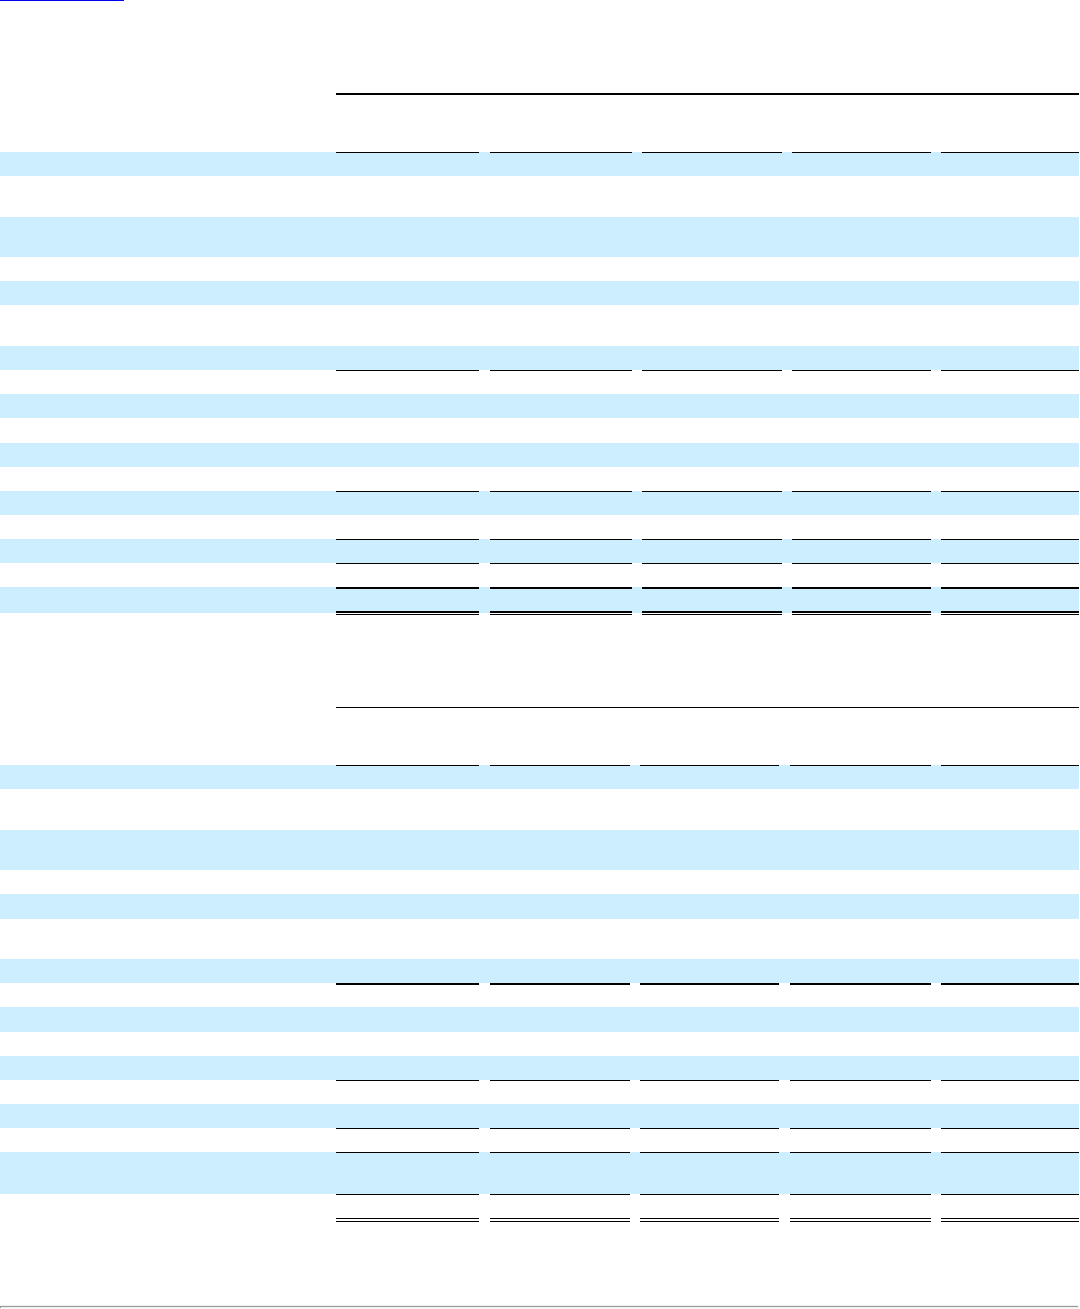
Table of Contents
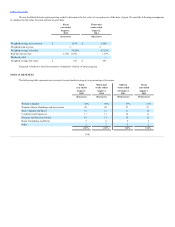
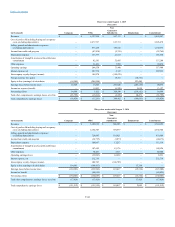
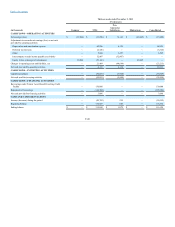
Revenues
$ —
$ 4,127,954
$ 967,133
$ —
$ 5,095,087
Cost of goods sold including buying and occupancy
costs (excluding depreciation)
—
2,677,767
627,711
—
3,305,478
Selling, general and administrative expenses
(excluding depreciation)
—
975,259
186,816
—
1,162,075
Income from credit card program
—
(47,434)
(5,335)
—
(52,769)
Depreciation expense
—
163,737
21,813
—
185,550
Amortization of intangible assets and favorable lease
commitments
—
82,185
55,095
—
137,280
Other expenses
—
31,881
7,593
—
39,474
Operating earnings
—
244,559
73,440
—
317,999
Interest expense, net
—
287,776
2,147
—
289,923
Intercompany royalty charges (income)
—
148,678
(148,678)
—
—
Foreign currency loss (gain)
—
—
18,351
(18,351)
—
Equity in loss (earnings) of subsidiaries
(14,949)
(208,540)
—
223,489
—
Earnings (loss) before income taxes
14,949
16,645
201,620
(205,138)
28,076
Income tax expense (benefit)
—
15,023
(6,920)
5,024
13,127
Net earnings (loss)
$ 14,949
$ 1,622
$ 208,540
$ (210,162)
$ 14,949
Total other comprehensive earnings (loss), net of tax
(33,799)
(16,913)
(3,558)
20,471
(33,799)
Total comprehensive earnings (loss)
$ (18,850)
$ (15,291)
$ 204,982
$ (189,691)
$ (18,850)
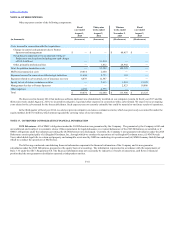
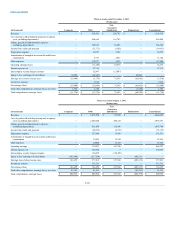
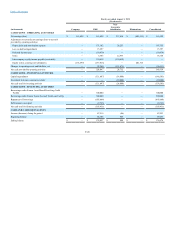
Revenues
$ —
$ 3,103,810
$ 606,383
$ —
$ 3,710,193
Cost of goods sold including buying and occupancy
costs (excluding depreciation)
—
2,164,309
398,679
—
2,562,988
Selling, general and administrative expenses
(excluding depreciation)
—
724,085
110,921
—
835,006
Income from credit card program
—
(36,795)
(3,877)
—
(40,672)
Depreciation expense
—
100,097
13,237
—
113,334
Amortization of intangible assets and favorable lease
commitments
—
107,450
41,176
—
148,626
Other expenses
—
78,467
3,613
—
82,080
Operating earnings (loss)
—
(33,803)
42,634
—
8,831
Interest expense, net
—
232,739
—
—
232,739
Intercompany royalty charges (income)
—
106,783
(106,783)
—
—
Equity in loss (earnings) of subsidiaries
134,083
(149,417)
—
15,334
—
Earnings (loss) before income taxes
(134,083)
(223,908)
149,417
(15,334)
(223,908)
Income tax benefit
—
(89,825)
—
—
(89,825)
Net earnings (loss)
$ (134,083)
$ (134,083)
$ 149,417
$ (15,334)
$ (134,083)
Total other comprehensive earnings (loss), net of tax
(17,429)
(17,429)
—
17,429
(17,429)
Total comprehensive earnings (loss)
$ (151,512)
$ (151,512)
$ 149,417
$ 2,095
$ (151,512)
F-44