Neiman Marcus 2014 Annual Report Download - page 143
Download and view the complete annual report
Please find page 143 of the 2014 Neiman Marcus annual report below. You can navigate through the pages in the report by either clicking on the pages listed below, or by using the keyword search tool below to find specific information within the annual report.-
 1
1 -
2
-
3
-
4
-
5
-
6
-
7
-
8
-
9
-
10
-
11
-
12
-
13
-
14
-
15
-
16
-
17
-
18
-
19
-
20
-
21
-
22
-
23
-
24
-
25
-
26
-
27
-
28
-
29
-
30
-
31
-
32
-
33
-
34
-
35
-
36
-
37
-
38
-
39
-
40
-
41
-
42
-
43
-
44
-
45
-
46
-
47
-
48
-
49
-
50
-
51
-
52
-
53
-
54
-
55
-
56
-
57
-
58
-
59
-
60
-
61
-
62
-
63
-
64
-
65
-
66
-
67
-
68
-
69
-
70
-
71
-
72
-
73
-
74
-
75
-
76
-
77
-
78
-
79
-
80
-
81
-
82
-
83
-
84
-
85
-
86
-
87
-
88
-
89
-
90
-
91
-
92
-
93
-
94
-
95
-
96
-
97
-
98
-
99
-
100
-
101
-
102
-
103
-
104
-
105
-
106
-
107
-
108
-
109
-
110
-
111
-
112
-
113
-
114
-
115
-
116
-
117
-
118
-
119
-
120
-
121
-
122
-
123
-
124
-
125
-
126
-
127
-
128
-
129
-
130
-
131
-
132
-
 133
133 -
 134
134 -
 135
135 -
 136
136 -
 137
137 -
 138
138 -
 139
139 -
 140
140 -
 141
141 -
 142
142 -
 143
143 -
 144
144 -
 145
145 -
 146
146 -
 147
147 -
 148
148 -
 149
149 -
 150
150 -
 151
151 -
 152
152 -
 153
153 -
154
-
155
-
156
-
157
-
158
-
159
-
160
-
161
 |
 |
Table of Contents
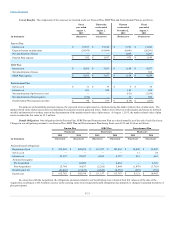
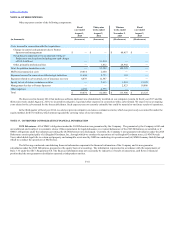
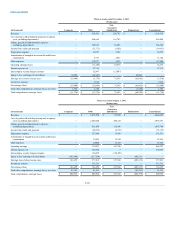
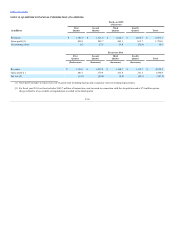
We use the Black-Scholes option-pricing model to determine the fair value of our options as of the date of grant. We used the following assumptions
to estimate the fair value for stock options at grant date:
Weighted average exercise price
$ 1,166
$ 1,000
Weighted term in years
5
5
Weighted average volatility
30.20%
45.12%
Risk-free interest rate
1.55% - 1.63%
1.39%
Dividend yield
—
—
Weighted average fair value
$ 343
$ 407
Expected volatility is based on estimates of implied volatility of our peer group.
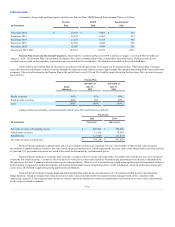
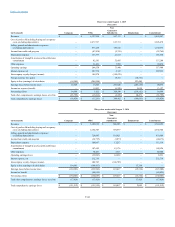
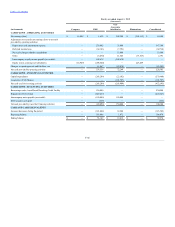
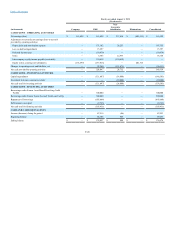
The following table represents our revenues by merchandise category as a percentage of revenues:
Women’s Apparel
32%
30%
33%
31%
Women’s Shoes, Handbags and Accessories
28
28
27
27
Men’s Apparel and Shoes
12
12
11
12
Cosmetics and Fragrances
11
11
12
11
Designer and Precious Jewelry
10
11
10
12
Home Furnishings and Decor
5
6
5
5
Other
2
2
2
2
100%
100%
100%
100%
F-40