Neiman Marcus 2014 Annual Report Download - page 36
Download and view the complete annual report
Please find page 36 of the 2014 Neiman Marcus annual report below. You can navigate through the pages in the report by either clicking on the pages listed below, or by using the keyword search tool below to find specific information within the annual report.-
 1
1 -
2
-
3
-
4
-
5
-
6
-
7
-
8
-
9
-
10
-
11
-
12
-
13
-
14
-
15
-
16
-
17
-
18
-
19
-
20
-
21
-
22
-
23
-
24
-
25
-
 26
26 -
 27
27 -
 28
28 -
 29
29 -
 30
30 -
 31
31 -
 32
32 -
 33
33 -
 34
34 -
 35
35 -
 36
36 -
 37
37 -
 38
38 -
 39
39 -
 40
40 -
 41
41 -
 42
42 -
 43
43 -
 44
44 -
 45
45 -
 46
46 -
47
-
48
-
49
-
50
-
51
-
52
-
53
-
54
-
55
-
56
-
57
-
58
-
59
-
60
-
61
-
62
-
63
-
64
-
65
-
66
-
67
-
68
-
69
-
70
-
71
-
72
-
73
-
74
-
75
-
76
-
77
-
78
-
79
-
80
-
81
-
82
-
83
-
84
-
85
-
86
-
87
-
88
-
89
-
90
-
91
-
92
-
93
-
94
-
95
-
96
-
97
-
98
-
99
-
100
-
101
-
102
-
103
-
104
-
105
-
106
-
107
-
108
-
109
-
110
-
111
-
112
-
113
-
114
-
115
-
116
-
117
-
118
-
119
-
120
-
121
-
122
-
123
-
124
-
125
-
126
-
127
-
128
-
129
-
130
-
131
-
132
-
133
-
134
-
135
-
136
-
137
-
138
-
139
-
140
-
141
-
142
-
143
-
144
-
145
-
146
-
147
-
148
-
149
-
150
-
151
-
152
-
153
-
154
-
155
-
156
-
157
-
158
-
159
-
160
-
161
 |
 |
Table of Contents
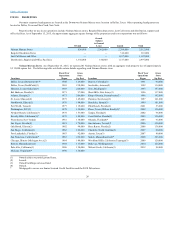
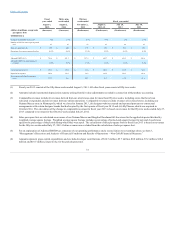
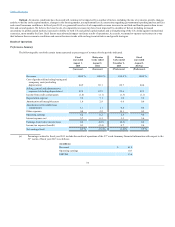
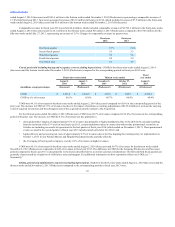
Set forth in the following table is certain summary information with respect to our operations for the periods indicated.
Change in Comparable Revenues (2)
Total revenues
3.9%
5.4%
5.7%
4.9%
Online revenues
13.0%
14.0%
11.2%
15.8%
Store Count
Neiman Marcus and Bergdorf Goodman full-line stores
open at end of period
43
43
43
43
Last Call stores open at end of period
43
38
36
36
Sales per square foot (3)
$ 590
$ 440
$ 138
$ 552
Percentage of revenues transacted online
26.3%
24.6%
21.4%
22.2%
Capital expenditures (4)
$ 270.5
$ 138.0
$ 36.0
$ 146.5
Depreciation expense
185.6
113.3
34.2
141.5
Rent expense and related occupancy costs
117.1
79.6
24.1
96.7
Non-GAAP Financial Measures
EBITDA (5)
$ 640.8
$ 270.8
$ 78.1
$ 635.3
Adjusted EBITDA (5)
$ 710.6
$ 501.3
$ 197.2
$ 682.7
(1) Fiscal year 2013 consists of the fifty-three weeks ended August 3, 2013, except where noted. In fiscal year 2013, we generated revenues of $61.9
million and EBITDA of $13.6 million in the 53rd week.
(2) Comparable revenues include (i) revenues derived from our retail stores open for more than fifty-two weeks, including stores that have been
relocated or expanded, and (ii) revenues from our online operations. Comparable revenues exclude revenues of (i) closed stores, including our
Neiman Marcus store in Minneapolis, which we closed in January 2013, (ii) designer websites created and operated pursuant to contractual
arrangements with certain designer brands that had expired by the first quarter of fiscal year 2015 and (iii) MyTheresa, which was acquired in
October 2014. The calculation of the change in comparable revenues for fiscal year 2013 is based on revenues for the fifty-two weeks ended July 27,
2013 compared to revenues for the fifty-two weeks ended July 28, 2012.
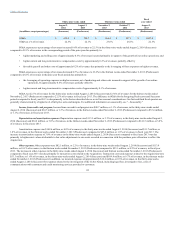
(3) Sales per square foot are calculated as revenues of our Neiman Marcus and Bergdorf Goodman full-line stores for the applicable period divided by
weighted average square footage. Weighted average square footage includes a percentage of period-end square footage for new and closed stores
equal to the percentage of the period during which they were open. The calculation of sales per square foot for fiscal year 2013 is based on revenues
for the fifty-two weeks ended July 27, 2013. Online revenues are excluded from the calculation of sales per square foot.
(4) Amounts represent gross capital expenditures and exclude developer contributions of $34.7 million, $5.7 million, $0.0 million and $7.2 million,
respectively, for the periods presented.
(5) For an explanation of EBITDA and Adjusted EBITDA as measures of our operating performance and a reconciliation to net earnings (loss), see “—
Non-GAAP Financial Measures.”
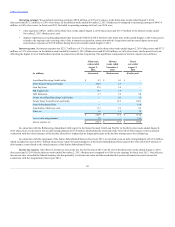
Revenues. We generate our revenues from the sale of luxury merchandise. Components of our revenues include:
• Sales of merchandise—Revenues are recognized at the later of the point-of-sale or the delivery of goods to the customer. Revenues are reduced
when our customers return goods previously purchased. We maintain reserves for anticipated sales returns primarily based on our historical
trends. Revenues exclude sales taxes collected from our customers.
35