Chrysler 2003 Annual Report Download - page 97
Download and view the complete annual report
Please find page 97 of the 2003 Chrysler annual report below. You can navigate through the pages in the report by either clicking on the pages listed below, or by using the keyword search tool below to find specific information within the annual report.-
 1
1 -
2
-
3
-
4
-
5
-
6
-
7
-
8
-
9
-
10
-
11
-
12
-
13
-
14
-
15
-
16
-
17
-
18
-
19
-
20
-
21
-
22
-
23
-
24
-
25
-
26
-
27
-
28
-
29
-
30
-
31
-
32
-
33
-
34
-
35
-
36
-
37
-
38
-
39
-
40
-
41
-
42
-
43
-
44
-
45
-
46
-
47
-
48
-
49
-
50
-
51
-
52
-
53
-
54
-
55
-
56
-
57
-
58
-
59
-
60
-
61
-
62
-
63
-
64
-
65
-
66
-
67
-
68
-
69
-
70
-
71
-
72
-
73
-
74
-
75
-
76
-
77
-
78
-
79
-
80
-
81
-
82
-
83
-
84
-
85
-
86
-
 87
87 -
 88
88 -
 89
89 -
 90
90 -
 91
91 -
 92
92 -
 93
93 -
 94
94 -
 95
95 -
 96
96 -
 97
97 -
 98
98 -
 99
99 -
 100
100 -
 101
101 -
 102
102 -
 103
103 -
 104
104 -
 105
105 -
 106
106 -
 107
107 -
108
-
109
-
110
-
111
-
112
-
113
-
114
-
115
-
116
-
117
-
118
-
119
-
120
-
121
-
122
-
123
-
124
-
125
-
126
-
127
-
128
-
129
-
130
-
131
-
132
-
133
-
134
-
135
-
136
-
137
-
138
-
139
-
140
-
141
-
142
-
143
-
144
-
145
-
146
-
147
-
148
-
149
-
150
-
151
-
152
-
153
-
154
-
155
-
156
-
157
-
158
-
159
-
160
-
161
-
162
-
163
-
164
-
165
-
166
-
167
-
168
-
169
-
170
-
171
-
172
-
173
-
174
-
175
-
176
-
177
-
178
-
179
-
180
-
181
-
182
-
183
-
184
-
185
-
186
-
187
-
188
-
189
-
190
-
191
-
192
-
193
-
194
-
195
-
196
-
197
-
198
-
199
-
200
-
201
-
202
-
203
-
204
-
205
-
206
-
207
-
208
-
209
 |
 |

96 Fiat Group Consolidated Financial Statements at December 31, 2003
Notes to the Consolidated Financial Statements
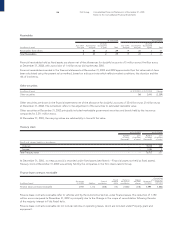
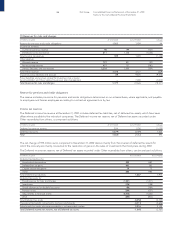
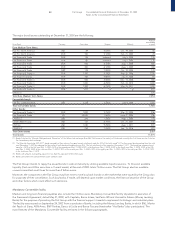
12 Payables
Payables may be analyzed by due date as follows:
At 12/31/2003 At 12/31/2002
Due Due Of which Due Due Of which
within beyond due beyond within beyond due beyond
(in millions of euros) one year one year five years Total one year one year five years Total
Bonds 1,034 8,576 3,804 9,610 1,853 9,020 3,243 10,873
Convertible bonds 1,765 – – 1,765 – 2,125 – 2,125
Borrowings from banks 2,697 6,687 115 9,384 4,482 8,558 300 13,040
Other financial payables 809 155 34 964 961 248 50 1,209
Advances (*) 2,877 6,272 – 9,149 3,603 5,707 – 9,310
Trade payables 11,733 36 – 11,769 12,056 96 – 12,152
Notes payable 224 1 – 225 973 664 – 1,637
Payables to unconsolidated subsidiaries 68 – – 68 63 – – 63
Payables to associated companies 842 – – 842 1,107 – – 1,107
Taxes payable 833 28 2 861 1,279 24 – 1,303
Social security payable 283 4 – 287 311 2 – 313
Other payables 1,288 28 – 1,316 1,729 327 – 2,056
Total Payables 24,453 21,787 3,955 46,240 28,417 26,771 3,593 55,188
(*) of which Advance payments on contract work in progress totals 8,448 million euros at December 31, 2003 (8,227 million euros at December 31, 2002)
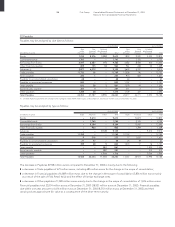
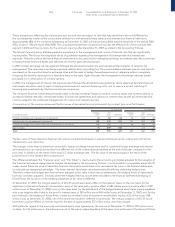
Payables may be analyzed by type as follows:
At 12/31/2003 At 12/31/2002
(in millions of euros) Trade Financial Other Total Trade Financial Other Total
Bonds – 9,610 – 9,610 – 10,873 – 10,873
Convertible bonds – 1,765 – 1,765 – 2,125 – 2,125
Borrowings from banks – 9,384 – 9,384 – 13,040 – 13,040
Other financial payables – 964 – 964 – 1,209 – 1,209
Advances – – 9,149 9,149 – – 9,310 9,310
Trade payables 11,769 – – 11,769 12,152 – – 12,152
Notes payable 9 216 – 225 17 1,620 – 1,637
Payables to unconsolidated subsidiaries 21 47 – 68 24 39 – 63
Payables to associated companies 789 48 5 842 1,074 17 16 1,107
Taxes payable – – 861 861 – – 1,303 1,303
Social security payable – – 287 287 – – 313 313
Other payables – – 1,316 1,316 – – 2,056 2,056
Total Payables 12,588 22,034 11,618 46,240 13,267 28,923 12,998 55,188
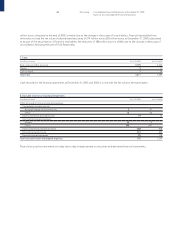
The decrease in Payables (8,948 million euros) compared to December 31, 2002 is mainly due to the following:
❚a decrease in Trade payables of 679 million euros, including 685 million euros for the change in the scope of consolidation;
❚a decrease in Financial payables of 6,889 million euros due to the change in the scope of consolidation (3,836 million euros mainly
as a result of the sale of Fidis Retail Italia) and the effect of foreign exchange rates.
❚a decrease in Other payables of 1,380 million euros mainly due to the change in the scope of consolidation of 1,076 million euros.
Financial payables total 22,034 million euros at December 31, 2003 (28,923 million euros at December 31, 2002). Financial payables
due within one year amount to 6,616 million euros at December 31, 2003 (8,310 million euros at December 31, 2002) and their
carrying values approximate fair value as a consequence of the short-term maturity.