Chrysler 2003 Annual Report Download - page 110
Download and view the complete annual report
Please find page 110 of the 2003 Chrysler annual report below. You can navigate through the pages in the report by either clicking on the pages listed below, or by using the keyword search tool below to find specific information within the annual report.-
 1
1 -
2
-
3
-
4
-
5
-
6
-
7
-
8
-
9
-
10
-
11
-
12
-
13
-
14
-
15
-
16
-
17
-
18
-
19
-
20
-
21
-
22
-
23
-
24
-
25
-
26
-
27
-
28
-
29
-
30
-
31
-
32
-
33
-
34
-
35
-
36
-
37
-
38
-
39
-
40
-
41
-
42
-
43
-
44
-
45
-
46
-
47
-
48
-
49
-
50
-
51
-
52
-
53
-
54
-
55
-
56
-
57
-
58
-
59
-
60
-
61
-
62
-
63
-
64
-
65
-
66
-
67
-
68
-
69
-
70
-
71
-
72
-
73
-
74
-
75
-
76
-
77
-
78
-
79
-
80
-
81
-
82
-
83
-
84
-
85
-
86
-
87
-
88
-
89
-
90
-
91
-
92
-
93
-
94
-
95
-
96
-
97
-
98
-
99
-
 100
100 -
 101
101 -
 102
102 -
 103
103 -
 104
104 -
 105
105 -
 106
106 -
 107
107 -
 108
108 -
 109
109 -
 110
110 -
 111
111 -
 112
112 -
 113
113 -
 114
114 -
 115
115 -
 116
116 -
 117
117 -
 118
118 -
 119
119 -
 120
120 -
121
-
122
-
123
-
124
-
125
-
126
-
127
-
128
-
129
-
130
-
131
-
132
-
133
-
134
-
135
-
136
-
137
-
138
-
139
-
140
-
141
-
142
-
143
-
144
-
145
-
146
-
147
-
148
-
149
-
150
-
151
-
152
-
153
-
154
-
155
-
156
-
157
-
158
-
159
-
160
-
161
-
162
-
163
-
164
-
165
-
166
-
167
-
168
-
169
-
170
-
171
-
172
-
173
-
174
-
175
-
176
-
177
-
178
-
179
-
180
-
181
-
182
-
183
-
184
-
185
-
186
-
187
-
188
-
189
-
190
-
191
-
192
-
193
-
194
-
195
-
196
-
197
-
198
-
199
-
200
-
201
-
202
-
203
-
204
-
205
-
206
-
207
-
208
-
209
 |
 |

109 Fiat Group Consolidated Financial Statements at December 31, 2003
Notes to the Consolidated Financial Statements
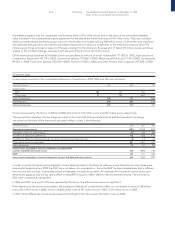
Personnel costs amount to 6,688 million euros in 2003, a decrease of 11.5% compared to 2002, mostly due to the effects of the
change in the scope of consolidation. On a comparable consolidation basis, the decrease would be 5%. Personnel costs are equal
to 14.1% of revenues (13.6% in 2002). Personnel costs as a percentage of revenues, on a comparable consolidation basis, would be
14.5% (14.3% in 2002).
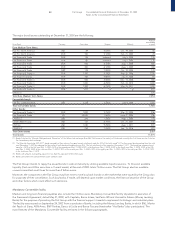
An analysis of the average number of employees by category is provided as follows:
2003 2002 2001
Companies Companies Companies Companies Companies Companies
consolidated consolidated consolidated consolidated consolidated consolidated
on a by the on a by the on a by the
line-by-line proportional line-by-line proportional line-by-line proportional
basis method Total basis method Total basis method Total
Average number of employees
Managers 2,948 – 2,948 3,483 2 3,485 3,500 39 3,539
White-collar 60,407 – 60,407 67,487 114 67,601 69,299 1,823 71,122
Blue-collar 110,887 – 110,887 118,999 320 119,319 135,945 3,566 139,511
Total 174,242 – 174,242 189,969 436 190,405 208,744 5,428 214,172
The average number of employees in 2003 is equal to 174,242, a decrease of 16,163 employees compared to 2002. That reduction
is partly due to employees who left the Group, also in connection with employee reduction plans, and partly to the change in the
scope of consolidation mainly as a result of the sale of FiatAvio S.p.A., the Toro Assicurazioni Group, the Fraikin activities and the
retail financing activities of the Automobile Sector.
In 2003, there are no companies accounted for using the proportional method owing to the accounting of Naveco by the equity
method (in 2002 this company was consolidated by the proportional method) and the deconsolidation of the companies held by
FiatAvio S.p.A.
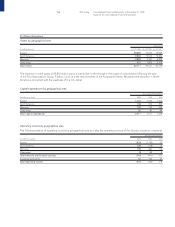
Provisions for risks
Provisions for risks of 1,163 million euros in 2003 (1,138 million euros in 2002) relate to the vehicle warranty reserve for 490 million
euros in 2003 (435 million euros in 2002), mainly in the Automotive Sectors, and to other reserves connected with industrial risks
for 673 million euros (703 million euros in 2002).
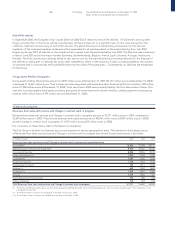
Other operating costs
(in millions of euros) 2003 2002 2001
Losses on sale of fixed assets 47 86 137
Prior period expenses 226 297 198
Indirect and other taxes 147 229 260
Sundry expenses 608 692 714
Total Other operating costs 1,028 1,304 1,309
Insurance claims and other insurance costs
Insurance claims and other insurance costs amount to 1,367 million euros in 2003 (4,045 million euros in 2002). The decrease from
2002 is due to the sale of the Toro Assicurazioni Group.
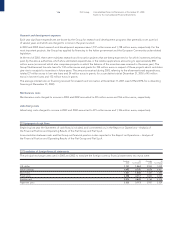
17 Financial income and expenses
Investment income
(in millions of euros) 2003 2002 2001
Dividends 12 103 102
Tax credit on dividends 522 112
Gains on sale of investments held in current assets 531 50
Total Investment income 22 156 264