Chrysler 2003 Annual Report Download - page 22
Download and view the complete annual report
Please find page 22 of the 2003 Chrysler annual report below. You can navigate through the pages in the report by either clicking on the pages listed below, or by using the keyword search tool below to find specific information within the annual report.-
 1
1 -
2
-
3
-
4
-
5
-
6
-
7
-
8
-
9
-
10
-
11
-
 12
12 -
 13
13 -
 14
14 -
 15
15 -
 16
16 -
 17
17 -
 18
18 -
 19
19 -
 20
20 -
 21
21 -
 22
22 -
 23
23 -
 24
24 -
 25
25 -
 26
26 -
 27
27 -
 28
28 -
 29
29 -
 30
30 -
 31
31 -
 32
32 -
33
-
34
-
35
-
36
-
37
-
38
-
39
-
40
-
41
-
42
-
43
-
44
-
45
-
46
-
47
-
48
-
49
-
50
-
51
-
52
-
53
-
54
-
55
-
56
-
57
-
58
-
59
-
60
-
61
-
62
-
63
-
64
-
65
-
66
-
67
-
68
-
69
-
70
-
71
-
72
-
73
-
74
-
75
-
76
-
77
-
78
-
79
-
80
-
81
-
82
-
83
-
84
-
85
-
86
-
87
-
88
-
89
-
90
-
91
-
92
-
93
-
94
-
95
-
96
-
97
-
98
-
99
-
100
-
101
-
102
-
103
-
104
-
105
-
106
-
107
-
108
-
109
-
110
-
111
-
112
-
113
-
114
-
115
-
116
-
117
-
118
-
119
-
120
-
121
-
122
-
123
-
124
-
125
-
126
-
127
-
128
-
129
-
130
-
131
-
132
-
133
-
134
-
135
-
136
-
137
-
138
-
139
-
140
-
141
-
142
-
143
-
144
-
145
-
146
-
147
-
148
-
149
-
150
-
151
-
152
-
153
-
154
-
155
-
156
-
157
-
158
-
159
-
160
-
161
-
162
-
163
-
164
-
165
-
166
-
167
-
168
-
169
-
170
-
171
-
172
-
173
-
174
-
175
-
176
-
177
-
178
-
179
-
180
-
181
-
182
-
183
-
184
-
185
-
186
-
187
-
188
-
189
-
190
-
191
-
192
-
193
-
194
-
195
-
196
-
197
-
198
-
199
-
200
-
201
-
202
-
203
-
204
-
205
-
206
-
207
-
208
-
209
 |
 |

Outside Western Europe, sales volumes expanded markedly
in Poland (+15.9%), stimulated by the strong surge in
demand. In Brazil, annual sales fell by 11.3% with respect to
2002, largely on account of market softness, although demand
and Sector sales recovered sharply in the last quarter of 2003.
❚In 2003 CNH posted revenues of 9,418 million euros, -10.4%
compared with the 10,513 million euros reported in the
previous year, in consequence of the negative foreign
exchange effect caused by the weakening of the dollar
against the euro. On a comparable exchange basis, revenues
would have been largely unchanged from the previous year,
insofar as the higher revenues from agricultural equipment
sales were offset by the reduction in revenues from
construction equipment.
Excluding the foreign exchange effect, revenues in the
agricultural equipment segment improved thanks to the sales
of new products. In particular, sales of combine harvesters
were strong on the principal markets, with a positive effect on
market shares compared with the previous year.
On a comparable exchange basis, revenues in the
construction equipment segment have continued to decrease
due to lower sales in Western Europe and Latin America,
partly connected to unfavorable market conditions, and in
North America where the decrease was smaller due to a
recovery in the sales of heavy equipment.
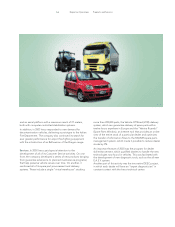
❚Iveco had revenues of 8,440 million euros in 2003, down by
7.6% from the 9,136 million euros reported in 2002, caused by
the disposal of activities and deconsolidation of Naveco. On
a comparable basis, revenues would have been virtually the
same as in 2002.
Iveco sold approximately 146,000 units, down 9.6% from the
previous year. In Western Europe, unit sales were down sharply
in Italy (-13.6%), caused by the strong contraction in demand
following the end of “Tremonti bis” law tax incentives, in
Great Britain (-14.9%) and in Germany (-6.7%), in contrast with
a slight increase in France, which went against the negative
market trend, and in Spain. The Sector maintained its
leadership in the Western European market for medium range
vehicles thanks to introduction of the New Eurocargo model.
❚Ferrari and Maserati reported revenues of 1,261 million euros
for the year, up 4.4% from the previous year notwithstanding
the negative foreign exchange effect. The improvement is
attributable to higher sales volumes for Ferrari models, while
Maserati sales suffered from the contraction in demand for
spider models in the United States.
❚Magneti Marelli ended the year with revenues of 3,206 million
euros; the 2.5% decrease with respect to the previous year
stemmed mainly from the foreign exchange effect. On a
comparable basis, revenues would have been 3.4% higher,
reflecting the positive performance of the Engine Control unit,
mainly as a result of the introduction of the diesel system, and
of the Lighting unit thanks to new products.
❚Comau posted revenues of 2,293 million euros, almost the
same as in the previous year. In North America, thanks to the
backlog of outstanding orders at the beginning of the year,
the Sector was able to record an increase in work completion
which made it possible to offset most of the negative effect
caused by the weakening of the dollar. Contract work in
Europe and the maintenance activities of Comau Service
confirmed the levels reported for 2002.
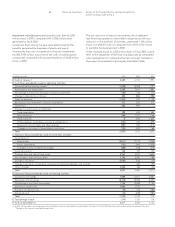
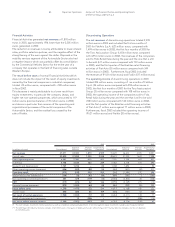
21 Report on Operations Analysis of the Financial Position and Operating Results
of the Fiat Group and Fiat S.p.A
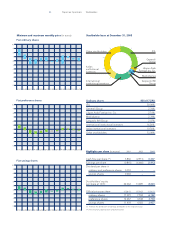
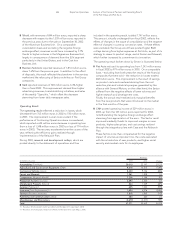
2003 2002
Continuing Discontinuing Continuing Discontinuing
(in millions of euros) Consolidated Operations Operations Consolidated Operations Operations
Net revenues 47,271 44,498 2,949 55,649 48,026 8,051
Cost of sales 40,830 38,468 2,538 48,619 41,949 7,098
Gross operating result 6,441 6,030 411 7,030 6,077 953
Overhead 4,748 4,509 239 5,782 5,192 590
Research and development 1,747 1,724 23 1,748 1,694 54
Other operating income (expenses) (456)(511)55 (262) (539) 277
Operating result (510)(714)204 (762) (1,348) 586
Investment income (expenses) (*) (156)(79)(46) (690) (261) (360)
Non-operating income (expenses) (**) 347 359 (12) (2,503) (2,267) (236)
EBIT (319)(434)146 (3,955) (3,876) (10)
Financial income (expenses) (979)(1,067)88 (862) (1,094) 232
Result before taxes (1,298)(1,501)234 (4,817) (4,970) 222
Income taxes 650 541 109 (554) (699) 145
Net result of normal operations (1,948)(2,042)125 (4,263) (4,271) 77
Result of intersegment equity investments –90 – – (14) (14)
Net result before minority interest (1,948)(1,952)125 (4,263) (4,285) 63
Group interest in net result (1,900) (3,948)
(*) This item includes investment income (expenses) as well as writedowns and upward adjustments in equity investments valued by the equity method.
(**) The 2003 figure of Continuing Operations includes 1,742 million euros in net gains on the disposal of Discontinuing Operations.