Chrysler 2003 Annual Report Download - page 33
Download and view the complete annual report
Please find page 33 of the 2003 Chrysler annual report below. You can navigate through the pages in the report by either clicking on the pages listed below, or by using the keyword search tool below to find specific information within the annual report.-
 1
1 -
2
-
3
-
4
-
5
-
6
-
7
-
8
-
9
-
10
-
11
-
12
-
13
-
14
-
15
-
16
-
17
-
18
-
19
-
20
-
21
-
22
-
 23
23 -
 24
24 -
 25
25 -
 26
26 -
 27
27 -
 28
28 -
 29
29 -
 30
30 -
 31
31 -
 32
32 -
 33
33 -
 34
34 -
 35
35 -
 36
36 -
 37
37 -
 38
38 -
 39
39 -
 40
40 -
 41
41 -
 42
42 -
 43
43 -
44
-
45
-
46
-
47
-
48
-
49
-
50
-
51
-
52
-
53
-
54
-
55
-
56
-
57
-
58
-
59
-
60
-
61
-
62
-
63
-
64
-
65
-
66
-
67
-
68
-
69
-
70
-
71
-
72
-
73
-
74
-
75
-
76
-
77
-
78
-
79
-
80
-
81
-
82
-
83
-
84
-
85
-
86
-
87
-
88
-
89
-
90
-
91
-
92
-
93
-
94
-
95
-
96
-
97
-
98
-
99
-
100
-
101
-
102
-
103
-
104
-
105
-
106
-
107
-
108
-
109
-
110
-
111
-
112
-
113
-
114
-
115
-
116
-
117
-
118
-
119
-
120
-
121
-
122
-
123
-
124
-
125
-
126
-
127
-
128
-
129
-
130
-
131
-
132
-
133
-
134
-
135
-
136
-
137
-
138
-
139
-
140
-
141
-
142
-
143
-
144
-
145
-
146
-
147
-
148
-
149
-
150
-
151
-
152
-
153
-
154
-
155
-
156
-
157
-
158
-
159
-
160
-
161
-
162
-
163
-
164
-
165
-
166
-
167
-
168
-
169
-
170
-
171
-
172
-
173
-
174
-
175
-
176
-
177
-
178
-
179
-
180
-
181
-
182
-
183
-
184
-
185
-
186
-
187
-
188
-
189
-
190
-
191
-
192
-
193
-
194
-
195
-
196
-
197
-
198
-
199
-
200
-
201
-
202
-
203
-
204
-
205
-
206
-
207
-
208
-
209
 |
 |

32 Report on Operations Analysis of the Financial Position and Operating Results
of the Fiat Group and Fiat S.p.A
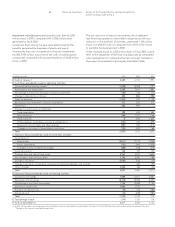
Balance Sheet by Activity Segment
At 12.31.2003 At 12.31.2002
Industrial Financial Discontinuing Industrial Financial Discontinuing
(in millions of euros) Consolidated Activities Activities Operations Consolidated Activities Activities Operations
❚ASSETS
Intangible fixed assets 3,724 3,600 124 – 5,200 4,242 157 801
Intangible fixed assets 1,322 1,293 29 – 1,600 1,340 31 229
Goodwill 2,402 2,307 95 – 3,600 2,902 126 572
Property, plant and equipment 9,675 8,750 925 – 12,106 9,450 1,179 1,477
Property, plant and equipment 8,761 8,742 19 – 10,521 9,450 60 1,011
Operating leases 914 8 906 – 1,585 – 1,119 466
Financial fixed assets 3,950 5,119 713 – 6,638 7,912 692 3,053
Investments on behalf of life insurance
policyholders who bear the risk ––––6,930 – – 6,930
Financial receivables held as fixed assets (*) 29 28 1 – 48 46 1 1
Deferred tax assets 1,879 1,794 81 4 3,499 3,192 187 120
Total Non-Current Assets 19,257 19,291 1,844 4 34,421 24,842 2,216 12,382
Net inventories (1) 6,912 6,878 34 7,050 6,423 37 590
Trade receivables 4,553 4,294 525 6 5,784 3,946 1,371 1,059
Other receivables 3,081 2,801 476 – 3,351 2,371 663 507
Financial assets not held as fixed assets 120 120 – – 6,094 143 – 5,956
Finance lease contracts receivable (*) 1,797 – 1,797 – 2,947 – 1,462 1,485
Financial receivables (*) 10,750 10,545 8,272 752 18,411 15,003 9,968 6,990
Financial receivables from others 10,750 2,086 7,917 747 18,411 2,456 9,479 6,476
Intersegment financial receivables – 8,459 355 5 – 12,547 489 514
Securities (*) 3,789 3,670 119 – 1,507 386 338 783
Cash (*) 3,211 3,121 77 13 3,489 2,746 153 590
Total Current Assets 34,213 31,429 11,300 771 48,633 31,018 13,992 17,960
Trade accruals and deferrals 407 347 40 24 579 402 64 117
Financial accruals and deferrals (*) 386 417 22 – 661 414 51 196
❚TOTAL ASSETS 54,263 51,484 13,206 799 84,294 56,676 16,323 30,655
❚LIABILITIES AND STOCKHOLDERS’ EQUITY
Stockholders’ equity 7,494 7,493 1,851 32 8,679 8,351 1,504 3,676
Deferred income tax reserves 211 135 76 – 1,236 940 148 148
Reserves for risks and charges 5,168 4,996 159 13 15,390 5,532 314 9,716
Reserves for employee severance indemnities 1,313 1,304 9 – 1,609 1,437 9 163
Policy liabilities and accruals where the
investment risk is borne by policyholders ––––7,000 – – 7,000
Long-term financial payables (*) 15,418 14,495 2,581 304 20,613 17,742 4,321 2,019
Financial payables to others 15,418 14,480 634 304 20,613 17,378 1,216 2,019
Intersegment financial payables – 15 1,947 – – 364 3,105 –
Total Non-Current
Liabilities 22,110 20,930 2,825 317 45,848 25,651 4,792 19,046
Trade payables 12,588 12,827 103 10 13,267 12,503 459 883
Other payables 3,170 3,042 235 11 4,771 3,546 246 1,187
Short-term financial payables (2) (*) 6,616 5,495 7,683 295 8,310 4,855 8,798 4,738
Financial payables to others 6,616 5,150 1,187 279 8,310 4,220 1,954 2,136
Intersegment financial payables – 345 6,496 16 – 635 6,844 2,602
Total Current Liabilities 22,374 21,364 8,021 316 26,348 20,904 9,503 6,808
Trade accruals and deferrals 1,329 1,165 141 25 1,499 1,145 205 149
Financial accruals and deferrals (*) 956 532 368 109 1,920 625 319 976
❚TOTAL LIABILITIES AND
STOCKHOLDERS’ EQUITY 54,263 51,484 13,206 799 84,294 56,676 16,323 30,655
❚NET FINANCIAL POSITION (*) (3,028)(2,741)(344)57 (3,780) (4,627) (1,465) 2,312
(1) Net of advances received for contract work in progress (8,448 million euros at December 31, 2003 and 8,227 million euros at December 31, 2002).
(2) The item includes the 1,765-million-euro exchangeable bond payable in 2004.