Chrysler 2003 Annual Report Download - page 63
Download and view the complete annual report
Please find page 63 of the 2003 Chrysler annual report below. You can navigate through the pages in the report by either clicking on the pages listed below, or by using the keyword search tool below to find specific information within the annual report.-
 1
1 -
2
-
3
-
4
-
5
-
6
-
7
-
8
-
9
-
10
-
11
-
12
-
13
-
14
-
15
-
16
-
17
-
18
-
19
-
20
-
21
-
22
-
23
-
24
-
25
-
26
-
27
-
28
-
29
-
30
-
31
-
32
-
33
-
34
-
35
-
36
-
37
-
38
-
39
-
40
-
41
-
42
-
43
-
44
-
45
-
46
-
47
-
48
-
49
-
50
-
51
-
52
-
 53
53 -
 54
54 -
 55
55 -
 56
56 -
 57
57 -
 58
58 -
 59
59 -
 60
60 -
 61
61 -
 62
62 -
 63
63 -
 64
64 -
 65
65 -
 66
66 -
 67
67 -
 68
68 -
 69
69 -
 70
70 -
 71
71 -
 72
72 -
 73
73 -
74
-
75
-
76
-
77
-
78
-
79
-
80
-
81
-
82
-
83
-
84
-
85
-
86
-
87
-
88
-
89
-
90
-
91
-
92
-
93
-
94
-
95
-
96
-
97
-
98
-
99
-
100
-
101
-
102
-
103
-
104
-
105
-
106
-
107
-
108
-
109
-
110
-
111
-
112
-
113
-
114
-
115
-
116
-
117
-
118
-
119
-
120
-
121
-
122
-
123
-
124
-
125
-
126
-
127
-
128
-
129
-
130
-
131
-
132
-
133
-
134
-
135
-
136
-
137
-
138
-
139
-
140
-
141
-
142
-
143
-
144
-
145
-
146
-
147
-
148
-
149
-
150
-
151
-
152
-
153
-
154
-
155
-
156
-
157
-
158
-
159
-
160
-
161
-
162
-
163
-
164
-
165
-
166
-
167
-
168
-
169
-
170
-
171
-
172
-
173
-
174
-
175
-
176
-
177
-
178
-
179
-
180
-
181
-
182
-
183
-
184
-
185
-
186
-
187
-
188
-
189
-
190
-
191
-
192
-
193
-
194
-
195
-
196
-
197
-
198
-
199
-
200
-
201
-
202
-
203
-
204
-
205
-
206
-
207
-
208
-
209
 |
 |

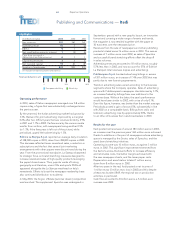
Operating performance
In 2003, sales of Italian newspapers averaged over 5.8 million
copies a day, a figure that was substantially unchanged since
the previous year.
By the year-end, the Italian advertising market had grown by
3.3%. Demand for print advertising improved by a marginal
0.2% after two difficult years that saw volumes shrink by 2.9%
in 2001 and 7.1% in 2002. Performance by the various media
was far from uniform, with newspapers losing another 0.5%
(or 1.3%, if the free press is left out of the picture), while
periodicals upped their advertising by 1.5%.
Editrice La Stampa S.p.A. reported an average daily circulation
of 358,000 copies in 2003, down from 384,000 copies in 2002.
This decrease reflected lower newsstand sales, a reduction in
subscriptions and the fact that several joint marketing
arrangements with other papers were discontinued during the
year. From the promotional standpoint, La Stampa sharpened
its strategic focus on brand stretching measures designed to
increase newsstand sales of high-quality products leveraging
the paper’s brand name. Thus, popular works of history,
geography and literature, music CDs and sports DVDs all
appeared alongside the La Stampa masthead on Italy’s
newsstands. Efforts to boost the newspaper readership base
also continued (distribution to students).
In May 2003, the Sogno d’Estate [summer dream] competition
was launched. The supplement Specchio was redesigned in
September: graced with a new graphic layout, an innovative
format and covering a wider range of events and trends,
the magazine is now retailed together with the paper at
30 eurocents over the newsstand price.
Revenues from the sale of newspapers and other publishing
products totaled some 76 million euros in 2003. This was an
increase of 1 million euros over 2002, as sales of Specchio
and successful brand stretching efforts offset the dropoff
in sales volumes.
Advertising revenues amounted to 92 million euros, roughly
5.7% less than in 2002, and now account for 57% of Editrice
La Stampa’s total revenues (copies and advertising).
Publikompass S.p.A. booked advertising billings in excess
of 307 million euros, an increase of 7.4% over 2002 that was
partly due to new licensing agreements.
Trends in advertising sales varied according to the business
segments where the Company operates. Sales of advertising
space with Publikompass’s newspaper clientele rose by 3.7%,
an increase fueled by billings from new additions to the
customer base. Without the latter, the year’s performance
would have been similar to 2002, with a rise of only 0.1%.
Even this figure, however, was better than the market average.
Periodicals posted a gain of around 5%, substantially in line
with 2002 on a comparable basis. Billings from radio and
television advertising rose by approximately 40%, thanks
to an influx of business from new broadcasters in 2003.
Results for the year
Itedi posted net revenues of around 383 million euros in 2003,
an increase over the previous years’ 360 million euros achieved
thanks to additions in the pool of newspapers whose advertising
space is managed by the Sector, sales of Specchio, and the
year’s brand stretching initiatives.
Operating income was 10 million euros, as against 3 million
euros in 2002. This significant improvement stemmed from
the Sector’s across-the-board efforts to increase efficiency
and rationalize costs, the better margins achieved with
the new newspaper clients, and the lower paper costs.
Depreciation and amortization totaled 7 million euros,
down from 8 million euros in 2002.
After two years in the red, Itedi posted a net income of
1 million euros (5 million euro loss in 2002) and this despite
a heavy tax burden (IRAP, the regional tax on production
activities, in particular).
Cash flow amounted to 8 million euros, a 5-million-euro
increase over 2002.
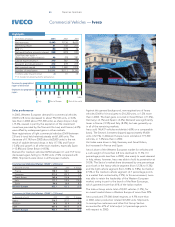
62 Report on Operations
Publishing and Communications — Itedi
(in millions of euros) 2003 2002 2001
Net revenues 383 360 347
Operating result 10 3(2)
EBIT (*) 91(4)
Net result before minority interest 1(5) (6)
Cash flow
(net result +
depreciation and amortization)
831
Capital expenditures 336
Net invested capital 19 40 49
Number of employees 874 923 934
(*) It includes non-operating income and expenses
Highlights
Revenues by business unit
0 50% 100%
Newspaper publishing Advertising