Chrysler 2003 Annual Report Download - page 61
Download and view the complete annual report
Please find page 61 of the 2003 Chrysler annual report below. You can navigate through the pages in the report by either clicking on the pages listed below, or by using the keyword search tool below to find specific information within the annual report.-
 1
1 -
2
-
3
-
4
-
5
-
6
-
7
-
8
-
9
-
10
-
11
-
12
-
13
-
14
-
15
-
16
-
17
-
18
-
19
-
20
-
21
-
22
-
23
-
24
-
25
-
26
-
27
-
28
-
29
-
30
-
31
-
32
-
33
-
34
-
35
-
36
-
37
-
38
-
39
-
40
-
41
-
42
-
43
-
44
-
45
-
46
-
47
-
48
-
49
-
50
-
 51
51 -
 52
52 -
 53
53 -
 54
54 -
 55
55 -
 56
56 -
 57
57 -
 58
58 -
 59
59 -
 60
60 -
 61
61 -
 62
62 -
 63
63 -
 64
64 -
 65
65 -
 66
66 -
 67
67 -
 68
68 -
 69
69 -
 70
70 -
 71
71 -
72
-
73
-
74
-
75
-
76
-
77
-
78
-
79
-
80
-
81
-
82
-
83
-
84
-
85
-
86
-
87
-
88
-
89
-
90
-
91
-
92
-
93
-
94
-
95
-
96
-
97
-
98
-
99
-
100
-
101
-
102
-
103
-
104
-
105
-
106
-
107
-
108
-
109
-
110
-
111
-
112
-
113
-
114
-
115
-
116
-
117
-
118
-
119
-
120
-
121
-
122
-
123
-
124
-
125
-
126
-
127
-
128
-
129
-
130
-
131
-
132
-
133
-
134
-
135
-
136
-
137
-
138
-
139
-
140
-
141
-
142
-
143
-
144
-
145
-
146
-
147
-
148
-
149
-
150
-
151
-
152
-
153
-
154
-
155
-
156
-
157
-
158
-
159
-
160
-
161
-
162
-
163
-
164
-
165
-
166
-
167
-
168
-
169
-
170
-
171
-
172
-
173
-
174
-
175
-
176
-
177
-
178
-
179
-
180
-
181
-
182
-
183
-
184
-
185
-
186
-
187
-
188
-
189
-
190
-
191
-
192
-
193
-
194
-
195
-
196
-
197
-
198
-
199
-
200
-
201
-
202
-
203
-
204
-
205
-
206
-
207
-
208
-
209
 |
 |
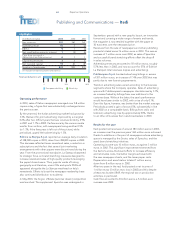
Operating performance
The recovery experienced to varying degrees in the world
economy in 2003 was not fully reflected in the automotive
markets where the Sector operates.
The light vehicles market owes its slight growth (+1.2%,
compared with +4.1% in 2002) entirely to the emerging
markets (especially Asia), which more than offset the decline
in Western Europe, the NAFTA area and South America.
After excellent performance in 2002 (when growth came to 9%),
the market for heavy commercial vehicles expanded by just 1.7%
in 2003 as a result of limited growth in the Asian markets (which
had boosted the levels for 2002), the virtual stability of the
Western European markets and the sharp contraction in the
NAFTA area. Teksid responded to the problems associated
with the limited growth in volumes and unfavorable exchange
rate developments by continuing its aggressive restructuring
plan. The plan, which was launched in 2002, involves both the
Cast Iron Business Unit and the Magnesium Business Unit
and is aimed at bringing production structures and income
generating capacity back into line in all production plants,
even under current market conditions.
The situation for the individual Business Units was as follows:
❚Although production volumes increased by 2.2% over the
previous year, the Cast Iron Business Unit saw a reduction
of 4.4% in revenues as a result of exchange rate movements.
Teksid nevertheless maintained a significant sales effort
in order to guarantee high levels of activity in its plants,
acquiring contracts for Japanese and Korean manufacturers
in China, for General Motors in Brazil and for Caterpillar in
Mexico and consolidating its relations with Renault and PSA
in Europe and Italy.
As part of the restructuring plan, the Crescentino plant
(Italy) reviewed its production strategy and by the end
of 2004 will increase its focus on the manufacture of
components for light vehicles. Other significant restructuring
measures were introduced at the SBFM and Funfrap plants
in France and Portugal respectively.
❚For the Magnesium Business Unit (Meridian), the marked
predominance of the North American market, which in
2003 accounted for 81% of revenues (compared with 83.2%
in 2002), was confirmed, as was the focus on serving
customers outside the Fiat Group, with the Group accounting
for just 6.4% of the total in 2003 (6.1% in 2002).
In spite of the increased volumes (up 8.1%), revenues were
penalized by exchange rate movements and decreased
by 4.1%.
Of particular significance in 2003 were the launch of
production at the UK plant (a branch of Meridian
Technologies Inc.) with the aim of serving all local customers’
needs, and the creation of SMMC, a joint venture in China
focusing on production for local manufacturers and, in the
medium term, on exports to the United States.
Results for the year
In 2003 the Sector posted revenues totaling 844 million
euros, a decline of 3.6% on 2002 on a comparable basis (i.e.
disregarding the Aluminum Business Unit, which was sold
in September 2002). With adjustments to offset the adverse
effects of the changes in the exchange rate scenario, revenues
would have increased by 3.7% on 2002. The portion (87%)
of revenues generated by “non-captive” customers showed
no change on the previous year.
The Sector posted operating income of 12 million euros for
the year. On a comparable basis the enhanced profitability
(up 2 million euros) can be attributed to the positive impact
of the higher volumes and the efficiency gains resulting from
the rationalization of staff structures and production units,
which more than offset the adverse effects of exchange rate
movements and the product mix. The restructuring plan and
prudential provisions against the potential impairment of some
assets generated net non-operating expenses of 62 million
euros (compared with 156 million euros in 2002). These are
the principal component of the net loss for the year of 91
million euros (compared with a loss of 214 million euros in 2002).
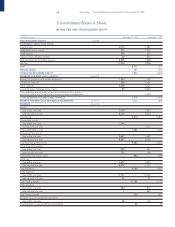
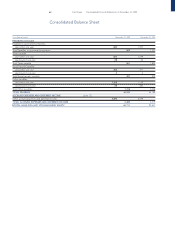
60 Report on Operations
Metallurgical Products — Teksid
Highlights
Revenues by geographical
region of destination
Employees by geographical
region
0 50% 100%
Italy Rest of Europe Rest of the world
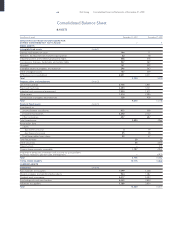
(in millions of euros) 2003 2002 2001
Net revenues 844 1,539 1,752
Operating result 12 27 15
EBIT (*) (56)(137) (67)
Net result before minority interest (91)(214) (125)
Cash flow
(net result +
depreciation and amortization)
(43)(121) (16)
Capital expenditures 56 78 151
Research and development 721 27
Net invested capital 194 250 788
Number of employees 7,556 7,368 13,827
(*) It includes non-operating income and expenses