Chrysler 2003 Annual Report Download - page 88
Download and view the complete annual report
Please find page 88 of the 2003 Chrysler annual report below. You can navigate through the pages in the report by either clicking on the pages listed below, or by using the keyword search tool below to find specific information within the annual report.-
 1
1 -
2
-
3
-
4
-
5
-
6
-
7
-
8
-
9
-
10
-
11
-
12
-
13
-
14
-
15
-
16
-
17
-
18
-
19
-
20
-
21
-
22
-
23
-
24
-
25
-
26
-
27
-
28
-
29
-
30
-
31
-
32
-
33
-
34
-
35
-
36
-
37
-
38
-
39
-
40
-
41
-
42
-
43
-
44
-
45
-
46
-
47
-
48
-
49
-
50
-
51
-
52
-
53
-
54
-
55
-
56
-
57
-
58
-
59
-
60
-
61
-
62
-
63
-
64
-
65
-
66
-
67
-
68
-
69
-
70
-
71
-
72
-
73
-
74
-
75
-
76
-
77
-
 78
78 -
 79
79 -
 80
80 -
 81
81 -
 82
82 -
 83
83 -
 84
84 -
 85
85 -
 86
86 -
 87
87 -
 88
88 -
 89
89 -
 90
90 -
 91
91 -
 92
92 -
 93
93 -
 94
94 -
 95
95 -
 96
96 -
 97
97 -
 98
98 -
99
-
100
-
101
-
102
-
103
-
104
-
105
-
106
-
107
-
108
-
109
-
110
-
111
-
112
-
113
-
114
-
115
-
116
-
117
-
118
-
119
-
120
-
121
-
122
-
123
-
124
-
125
-
126
-
127
-
128
-
129
-
130
-
131
-
132
-
133
-
134
-
135
-
136
-
137
-
138
-
139
-
140
-
141
-
142
-
143
-
144
-
145
-
146
-
147
-
148
-
149
-
150
-
151
-
152
-
153
-
154
-
155
-
156
-
157
-
158
-
159
-
160
-
161
-
162
-
163
-
164
-
165
-
166
-
167
-
168
-
169
-
170
-
171
-
172
-
173
-
174
-
175
-
176
-
177
-
178
-
179
-
180
-
181
-
182
-
183
-
184
-
185
-
186
-
187
-
188
-
189
-
190
-
191
-
192
-
193
-
194
-
195
-
196
-
197
-
198
-
199
-
200
-
201
-
202
-
203
-
204
-
205
-
206
-
207
-
208
-
209
 |
 |

87 Fiat Group Consolidated Financial Statements at December 31, 2003
Notes to the Consolidated Financial Statements
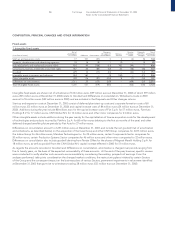
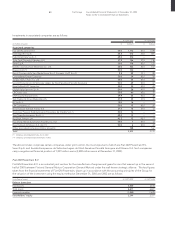
Investments where the investment risk is borne by policyholders and those related to pension plan management
(in millions of euros) At 12/31/2003 At 12/31/2002 Change
Investments where the investment risk is borne by policyholders
and those related to pension plan management –6,930 (6,930)
Investments for the benefit of life insurance policyholders, where the policyholders bear the risk, and pension plan assets, at
December 31, 2002 referred to the Toro Assicurazioni Group.
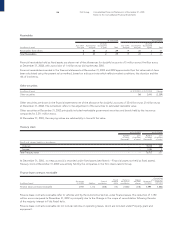
Current assets
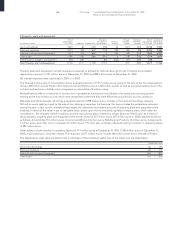
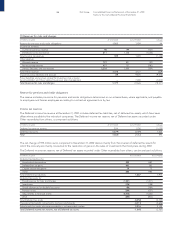
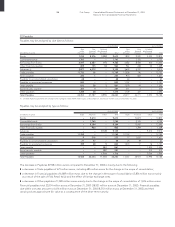
4 Inventories
At 12/31/2003 At 12/31/2002
(in millions of euros) Gross Allowance Net Gross Allowance Net
Raw materials and supplies 1,306 (207)1,099 1,382 (134) 1,248
Work in progress and semifinished products 966 (22)944 1,102 (20) 1,082
Contract work in progress 4,077 – 4,077 5,293 – 5,293
Finished goods and merchandise 4,482 (430)4,052 4,279 (449) 3,830
Advances to suppliers 5,188 – 5,188 3,824 – 3,824
Total Inventories 16,019 (659)15,360 15,880 (603) 15,277
Advance payments on contract work in progress (8,448)–(8,448) (8,227) – (8,227)
Net inventories 7,571 (659)6,912 7,653 (603) 7,050
Movements in the inventory allowance accounts during the year were as follows:
Foreign Change in
At Use and exchange the scope of At
(in millions of euros) 12/31/2002 provisions effects consolidation 12/31/2003
Allowance for inventory writedowns 603 93 (9) (28) 659
Inventories of 15,360 million euros at December 31, 2003 (15,277 million euros at December 31, 2002) increased by 83 million euros
compared to the prior year. Advance payments received from customers against contract work in progress amount to 8,448 million
euros (8,227 million euros at December 31, 2002) and are recorded in Payables (Note 12). Inventories, net of such advance payments
received from customers, amount to 6,912 million euros (7,050 million euros at December 31, 2002). Advances to suppliers principally
regard the amounts paid by the Fiat S.p.A. to the consortiums involved in the T.A.V. project. Contract work in progress decreased
mainly as a result of the Change in the scope of consolidation.
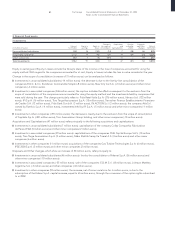
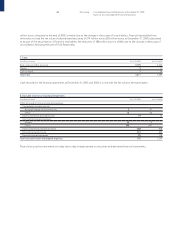
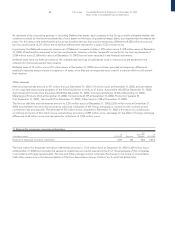
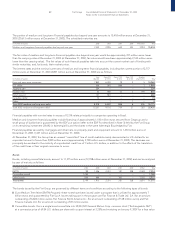
5 Receivables
An analysis of receivables by due date is as follows:
At 12/31/2003 At 12/31/2002
Due Due Of which Due Due Of which
within beyond due beyond within beyond due beyond
(in millions of euros) one year one year 5 years Total one year one year 5 years Total
Trade receivables 3,733 25 3 3,758 5,248 60 4 5,308
Receivables from unconsolidated subsidiaries 73 3 – 76 54 – – 54
Receivables from associated companies 764 – – 764 472 – – 472
Other receivables from:
Employees 33 2 – 35 36 3 – 39
Tax authorities 1,413 137 – 1,550 1,639 146 – 1,785
Social security agencies 14––1422 – – 22
Others 1,808 1,508 9 3,316 2,120 2,834 8 4,954
Total Other receivables 3,268 1,647 9 4,915 3,817 2,983 8 6,800
Total Receivables 7,838 1,675 12 9,513 9,591 3,043 12 12,634