Chrysler 2003 Annual Report Download - page 9
Download and view the complete annual report
Please find page 9 of the 2003 Chrysler annual report below. You can navigate through the pages in the report by either clicking on the pages listed below, or by using the keyword search tool below to find specific information within the annual report.-
 1
1 -
 2
2 -
 3
3 -
 4
4 -
 5
5 -
 6
6 -
 7
7 -
 8
8 -
 9
9 -
 10
10 -
 11
11 -
 12
12 -
 13
13 -
 14
14 -
 15
15 -
 16
16 -
 17
17 -
 18
18 -
 19
19 -
 20
20 -
21
-
22
-
23
-
24
-
25
-
26
-
27
-
28
-
29
-
30
-
31
-
32
-
33
-
34
-
35
-
36
-
37
-
38
-
39
-
40
-
41
-
42
-
43
-
44
-
45
-
46
-
47
-
48
-
49
-
50
-
51
-
52
-
53
-
54
-
55
-
56
-
57
-
58
-
59
-
60
-
61
-
62
-
63
-
64
-
65
-
66
-
67
-
68
-
69
-
70
-
71
-
72
-
73
-
74
-
75
-
76
-
77
-
78
-
79
-
80
-
81
-
82
-
83
-
84
-
85
-
86
-
87
-
88
-
89
-
90
-
91
-
92
-
93
-
94
-
95
-
96
-
97
-
98
-
99
-
100
-
101
-
102
-
103
-
104
-
105
-
106
-
107
-
108
-
109
-
110
-
111
-
112
-
113
-
114
-
115
-
116
-
117
-
118
-
119
-
120
-
121
-
122
-
123
-
124
-
125
-
126
-
127
-
128
-
129
-
130
-
131
-
132
-
133
-
134
-
135
-
136
-
137
-
138
-
139
-
140
-
141
-
142
-
143
-
144
-
145
-
146
-
147
-
148
-
149
-
150
-
151
-
152
-
153
-
154
-
155
-
156
-
157
-
158
-
159
-
160
-
161
-
162
-
163
-
164
-
165
-
166
-
167
-
168
-
169
-
170
-
171
-
172
-
173
-
174
-
175
-
176
-
177
-
178
-
179
-
180
-
181
-
182
-
183
-
184
-
185
-
186
-
187
-
188
-
189
-
190
-
191
-
192
-
193
-
194
-
195
-
196
-
197
-
198
-
199
-
200
-
201
-
202
-
203
-
204
-
205
-
206
-
207
-
208
-
209
 |
 |

8Report on Operations
Highlights of Results
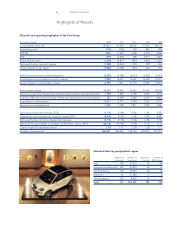
Financial and operating highlights of the Fiat Group
(in millions of euros) 2003 2002 2001 2000 1999
Consolidated revenues 47,271 55,649 58,006 57,555 48,123
Operating result (510) (762) 318 855 788
EBITDA 1,950 (1,341) 3,408 5,125 3,836
EBIT (319) (3,955) 528 2,073 1,482
Result before taxes (1,298) (4,817) (497) 1,050 1,024
Net result before minority interest (1,948) (4,263) (791) 578 506
Group interest in net result (1,900) (3,948) (445) 664 353
Net financial position positive/(negative) (3,028) (3,780) (6,035) (6,467) (4,031)
Stockholders’ equity before minority interest 7,494 8,679 13,607 15,209 14,767
Group interest in stockholders’ equity 6,793 7,641 12,170 13,320 12,874
Net invested capital 10,522 12,459 19,642 21,676 18,798
Operating cash flow (Operating result plus depreciation and amortization) 1,759 1,852 3,198 3,907 3,142
Cash flow (Net result before minority interest plus depreciation and amortization)
321 (1,649) 2,089 3,630 2,860
Investments in fixed assets 2,011 2,771 3,438 3,236 2,712
Research and development 1,747 1,748 1,817 1,725 1,406
Operating result/net revenues (ROS) (1.1%) (1.4%) 0.5% 1.5% 1.6%
Operating result/average net invested capital (ROI) (4.4%) (4.7%) 1.5% 4.2% 4.8%
Net result before minority interest/net revenues (4.1%) (7.7%) (1.4%) 1.0% 1.1%
Net result/Group interest in average stockholders’ equity (ROE) (26.3%) (39.9%) (3.5%) 5.1% 2.7%
Capital expenditures/depreciation 1.15 1.37 1.50 1.28 1.31
Number of employees 162,237 186,492 198,764 223,953 221,319
Statistical data by geographical region
Number of Number of Number of Number of
Companies Employees Facilities R&D Centers
Italy 199 73,553 56 48
Europe excluding Italy 326 44,870 66 33
North America 103 12,835 30 13
Mercosur 46 21,980 17 8
Other regions 103 8,999 23 7
Total 777 162,237 192 109