Chrysler 2003 Annual Report Download - page 10
Download and view the complete annual report
Please find page 10 of the 2003 Chrysler annual report below. You can navigate through the pages in the report by either clicking on the pages listed below, or by using the keyword search tool below to find specific information within the annual report.-
 1
1 -
 2
2 -
 3
3 -
 4
4 -
 5
5 -
 6
6 -
 7
7 -
 8
8 -
 9
9 -
 10
10 -
 11
11 -
 12
12 -
 13
13 -
 14
14 -
 15
15 -
 16
16 -
 17
17 -
 18
18 -
 19
19 -
 20
20 -
 21
21 -
22
-
23
-
24
-
25
-
26
-
27
-
28
-
29
-
30
-
31
-
32
-
33
-
34
-
35
-
36
-
37
-
38
-
39
-
40
-
41
-
42
-
43
-
44
-
45
-
46
-
47
-
48
-
49
-
50
-
51
-
52
-
53
-
54
-
55
-
56
-
57
-
58
-
59
-
60
-
61
-
62
-
63
-
64
-
65
-
66
-
67
-
68
-
69
-
70
-
71
-
72
-
73
-
74
-
75
-
76
-
77
-
78
-
79
-
80
-
81
-
82
-
83
-
84
-
85
-
86
-
87
-
88
-
89
-
90
-
91
-
92
-
93
-
94
-
95
-
96
-
97
-
98
-
99
-
100
-
101
-
102
-
103
-
104
-
105
-
106
-
107
-
108
-
109
-
110
-
111
-
112
-
113
-
114
-
115
-
116
-
117
-
118
-
119
-
120
-
121
-
122
-
123
-
124
-
125
-
126
-
127
-
128
-
129
-
130
-
131
-
132
-
133
-
134
-
135
-
136
-
137
-
138
-
139
-
140
-
141
-
142
-
143
-
144
-
145
-
146
-
147
-
148
-
149
-
150
-
151
-
152
-
153
-
154
-
155
-
156
-
157
-
158
-
159
-
160
-
161
-
162
-
163
-
164
-
165
-
166
-
167
-
168
-
169
-
170
-
171
-
172
-
173
-
174
-
175
-
176
-
177
-
178
-
179
-
180
-
181
-
182
-
183
-
184
-
185
-
186
-
187
-
188
-
189
-
190
-
191
-
192
-
193
-
194
-
195
-
196
-
197
-
198
-
199
-
200
-
201
-
202
-
203
-
204
-
205
-
206
-
207
-
208
-
209
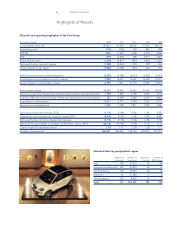
 |
 |

9Report on Operations
Cash flow Capital expenditures Net invested capital Number of employees
2003 2002 2003 2002 2003 2002 2003 2002
(in millions (in millions (in millions (in millions (in millions (in millions
of euros) of euros) of euros) of euros) of euros) of euros)
Automobiles (Fiat Auto) (1,096) (1,780) 1,100 1,116 1,806 1,254 44,563 49,544
Agricultural and Construction Equipment (CNH) 258 330 217 431 4,148 5,140 26,825 28,528
Commercial Vehicles (Iveco) 46 (70) 210 587 1,310 1,582 31,511 38,113
Ferrari and Maserati 86 99 193 176 229 142 2,968 2,896
Components (Magneti Marelli) 83 (245) 148 148 540 524 19,879 20,716
Production Systems (Comau) (108) (238) 18 20 205 163 17,375 18,186
Metallurgical Products (Teksid) (43) (121) 56 78 194 250 7,556 7,368
Aviation (FiatAvio) (*) 55 185 33 130 –618 –5,049
Insurance (Toro Assicurazioni) (**) 68 56 –14 –652 –3,098
Services (Business Solutions) 10 (77) 714 (31) 478 7,113 7,900
Publishing and Communications (Itedi) 833319 40 874 923
Miscellaneous and Eliminations 954 209 26 54 2,102 1,616 3,573 4,171
Total for the Group 321 (1,649) 2,011 2,771 10,522 12,459 162,237 186,492
(*) Data for the Aviation Sector are shown until the date of its sale (July 1, 2003).
(**) Data for the Insurance Sector are shown until the date of its sale (May 2, 2003).
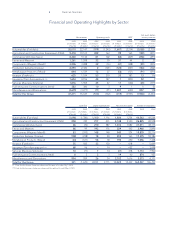
Net result before
Net revenues Operating result EBIT minority interest
2003 2002 2003 2002 2003 2002 2003 2002
(in millions (in millions (in millions (in millions (in millions (in millions (in millions (in millions
of euros) of euros) of euros) of euros) of euros) of euros) of euros) of euros)
Automobiles (Fiat Auto) 20,010 22,147 (979) (1,343) (1,607) (2,214) (2,058) (2,739)
Agricultural and Construction Equipment (CNH) 9,418 10,513 229 163 99 165 (192) (211)
Commercial Vehicles (Iveco) 8,440 9,136 81 102 (84) (409) (258) (493)
Ferrari and Maserati 1,261 1,208 32 70 31 44 222
Components (Magneti Marelli) 3,206 3,288 32 (16) (41) (348) (90) (435)
Production Systems (Comau) 2,293 2,320 2(101) (122) (247) (164) (302)
Metallurgical Products (Teksid) 844 1,539 12 27 (56) (137) (91) (214)
Aviation (FiatAvio) (*) 625 1,534 53 210 33 183 13 116
Insurance (Toro Assicurazioni) (**) 1,654 4,916 44 147 1(203) 52 9
Services (Business Solutions) 1,816 1,965 45 67 11 (140) (20) (119)
Publishing and Communications (Itedi) 383 360 10 3911(5)
Miscellaneous and Eliminations (2,679) (3,277) (71) (91) 1,407 (650) 857 108
Total for the Group 47,271 55,649 (510) (762) (319) (3,955) (1,948) (4,263)
Financial and Operating Highlights by Sector