Chrysler 2003 Annual Report Download - page 89
Download and view the complete annual report
Please find page 89 of the 2003 Chrysler annual report below. You can navigate through the pages in the report by either clicking on the pages listed below, or by using the keyword search tool below to find specific information within the annual report.-
 1
1 -
2
-
3
-
4
-
5
-
6
-
7
-
8
-
9
-
10
-
11
-
12
-
13
-
14
-
15
-
16
-
17
-
18
-
19
-
20
-
21
-
22
-
23
-
24
-
25
-
26
-
27
-
28
-
29
-
30
-
31
-
32
-
33
-
34
-
35
-
36
-
37
-
38
-
39
-
40
-
41
-
42
-
43
-
44
-
45
-
46
-
47
-
48
-
49
-
50
-
51
-
52
-
53
-
54
-
55
-
56
-
57
-
58
-
59
-
60
-
61
-
62
-
63
-
64
-
65
-
66
-
67
-
68
-
69
-
70
-
71
-
72
-
73
-
74
-
75
-
76
-
77
-
78
-
 79
79 -
 80
80 -
 81
81 -
 82
82 -
 83
83 -
 84
84 -
 85
85 -
 86
86 -
 87
87 -
 88
88 -
 89
89 -
 90
90 -
 91
91 -
 92
92 -
 93
93 -
 94
94 -
 95
95 -
 96
96 -
 97
97 -
 98
98 -
 99
99 -
100
-
101
-
102
-
103
-
104
-
105
-
106
-
107
-
108
-
109
-
110
-
111
-
112
-
113
-
114
-
115
-
116
-
117
-
118
-
119
-
120
-
121
-
122
-
123
-
124
-
125
-
126
-
127
-
128
-
129
-
130
-
131
-
132
-
133
-
134
-
135
-
136
-
137
-
138
-
139
-
140
-
141
-
142
-
143
-
144
-
145
-
146
-
147
-
148
-
149
-
150
-
151
-
152
-
153
-
154
-
155
-
156
-
157
-
158
-
159
-
160
-
161
-
162
-
163
-
164
-
165
-
166
-
167
-
168
-
169
-
170
-
171
-
172
-
173
-
174
-
175
-
176
-
177
-
178
-
179
-
180
-
181
-
182
-
183
-
184
-
185
-
186
-
187
-
188
-
189
-
190
-
191
-
192
-
193
-
194
-
195
-
196
-
197
-
198
-
199
-
200
-
201
-
202
-
203
-
204
-
205
-
206
-
207
-
208
-
209
 |
 |

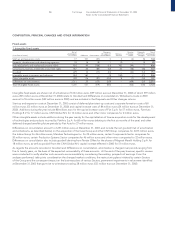
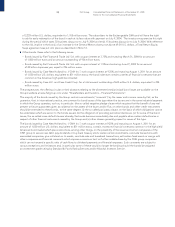
88 Fiat Group Consolidated Financial Statements at December 31, 2003
Notes to the Consolidated Financial Statements
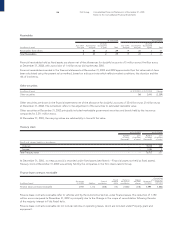
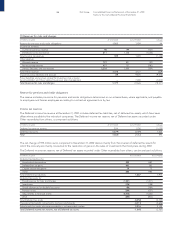
An analysis of receivables by type is as follows:
At 12/31/2003 At 12/31/2002
(in millions of euros) Trade Other Total Trade Other Total
Trade receivables 3,758 – 3,758 5,308 – 5,308
Receivables from unconsolidated subsidiaries 53 23 76 54 – 54
Receivables from associated companies 742 22 764 422 50 472
Other receivables from:
Employees –3535 –3939
Tax authorities – 1,550 1,550 – 1,785 1,785
Social security agencies –1414 –2222
Other – 3,316 3,316 – 4,954 4,954
Total Other receivables – 4,915 4,915 – 6,800 6,800
Total Receivables 4,553 4,960 9,513 5,784 6,850 12,634
of which:
Receivables included in working capital 4,553 3,081 7,634 5,784 3,351 9,135
Deferred tax assets – 1,879 1,879 – 3,499 3,499
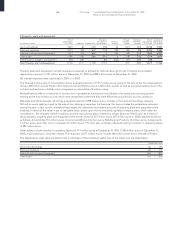
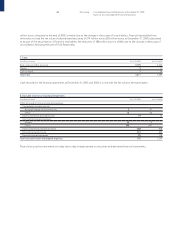
Trade receivables decreased by 1,231 million euros resulting from reductions of 1,106 million euros due to changes in the scope
of consolidation and 125 million euros due to current operations.
Trade receivables are shown net of allowances for doubtful accounts of 476 million euros at December 31, 2003 (549 million euros
at December 31, 2002). Movements in the allowance accounts during the year are as follows:
Use and Change in
At other the scope of At
(in millions of euros) 12/31/2002 Provisions changes consolidation 12/31/2003
Allowances for doubtful accounts 549 86 (109) (50) 476
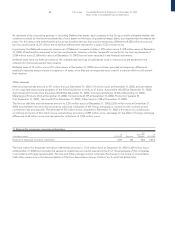
Receivables from tax authorities principally refer to VAT and income taxes receivable from the Italian tax authorities and include
the tax credit relating to the advance payments of income tax on employee severance indemnities paid by Italian companies.
The portion of interest accrued on that receivable relating to the current year is recorded in Financial income and expenses.
“Other receivables from others” include deferred tax assets of 1,879 million euros (3,499 million euros at December 31, 2002),
accounted for in accordance with the accounting policies described previously. Additional information on these assets is provided
in Note 10 - Reserves for risks and charges, under Deferred income tax reserve.
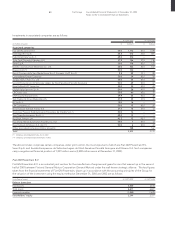
6 Financial assets not held as fixed assets
Investments
Investments in other companies amount to 32 million euros at December 31, 2003 (810 million euros at December 31, 2002) and show
a decrease of 778 million euros, mainly due to the sale of the Toro Assicurazioni Group.
Other securities
(in millions of euros) At 12/31/2003 At 12/31/2002 Change
Italian government securities 55 2,968 (2,913)
Other securities 3,790 3,801 (11)
Total Other securities 3,845 6,769 (2,924)
of which:
held by insurance companies 186 6,102 (5,916)
Italian government securities also include securities issued by other public entities and guaranteed by the Italian government.