Chrysler 2003 Annual Report Download - page 108
Download and view the complete annual report
Please find page 108 of the 2003 Chrysler annual report below. You can navigate through the pages in the report by either clicking on the pages listed below, or by using the keyword search tool below to find specific information within the annual report.-
 1
1 -
2
-
3
-
4
-
5
-
6
-
7
-
8
-
9
-
10
-
11
-
12
-
13
-
14
-
15
-
16
-
17
-
18
-
19
-
20
-
21
-
22
-
23
-
24
-
25
-
26
-
27
-
28
-
29
-
30
-
31
-
32
-
33
-
34
-
35
-
36
-
37
-
38
-
39
-
40
-
41
-
42
-
43
-
44
-
45
-
46
-
47
-
48
-
49
-
50
-
51
-
52
-
53
-
54
-
55
-
56
-
57
-
58
-
59
-
60
-
61
-
62
-
63
-
64
-
65
-
66
-
67
-
68
-
69
-
70
-
71
-
72
-
73
-
74
-
75
-
76
-
77
-
78
-
79
-
80
-
81
-
82
-
83
-
84
-
85
-
86
-
87
-
88
-
89
-
90
-
91
-
92
-
93
-
94
-
95
-
96
-
97
-
 98
98 -
 99
99 -
 100
100 -
 101
101 -
 102
102 -
 103
103 -
 104
104 -
 105
105 -
 106
106 -
 107
107 -
 108
108 -
 109
109 -
 110
110 -
 111
111 -
 112
112 -
 113
113 -
 114
114 -
 115
115 -
 116
116 -
 117
117 -
 118
118 -
119
-
120
-
121
-
122
-
123
-
124
-
125
-
126
-
127
-
128
-
129
-
130
-
131
-
132
-
133
-
134
-
135
-
136
-
137
-
138
-
139
-
140
-
141
-
142
-
143
-
144
-
145
-
146
-
147
-
148
-
149
-
150
-
151
-
152
-
153
-
154
-
155
-
156
-
157
-
158
-
159
-
160
-
161
-
162
-
163
-
164
-
165
-
166
-
167
-
168
-
169
-
170
-
171
-
172
-
173
-
174
-
175
-
176
-
177
-
178
-
179
-
180
-
181
-
182
-
183
-
184
-
185
-
186
-
187
-
188
-
189
-
190
-
191
-
192
-
193
-
194
-
195
-
196
-
197
-
198
-
199
-
200
-
201
-
202
-
203
-
204
-
205
-
206
-
207
-
208
-
209
 |
 |

107 Fiat Group Consolidated Financial Statements at December 31, 2003
Notes to the Consolidated Financial Statements
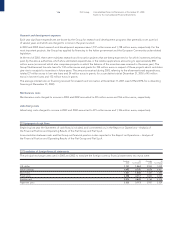
End-of-life vehicles
In September 2000, the European Union issued Directive 2000/53/CE relative to end-of-life vehicles. This Directive, among other
things, provides that, in the future, vehicle manufacturers will have to bear all, or a significant part of, the costs arising from the
collection, treatment and recovery of end-of-life vehicles. The above Directive is currently being introduced into the national
legislation of the individual member states and will be applicable for all vehicles placed on the market starting from July 2002;
beginning January 2007 all vehicles on the market will be covered, even those placed before July 2002. The Directive was introduced
in Italy in June 2003 and in the major markets (Germany, the Netherlands, Belgium, France, Spain, Slovenia, Portugal, Austria and
Norway). Fiat Auto is pursuing a strategy aimed at zero service cost for the manufacturer by promoting networks for the disposal of
the vehicles or taking part in networks set up by other competitors, which, in the majority of cases, is made possible by the creation
of a process that is economically self-sustained by the recovery value of the spare parts. Consequently, no liabilities are recognized
for the Group.
Group assets held by third parties
Group assets held by third parties amount to 4,496 million euros at December 31, 2003 (20,757 million euros at December 31, 2002),
a decrease of 16,261 million euros. They include securities deposited with banks and other financial institutions totaling 1,042 million
euros (17,558 million euros at December 31, 2002). Such securities in 2002 were primarily held by the Toro Assicurazioni Group. This
item also includes tangible fixed assets, products and goods of some Automotive Sectors held by outside suppliers for processing
totaling 3,454 million euros (3,199 million euros at December 31, 2002).
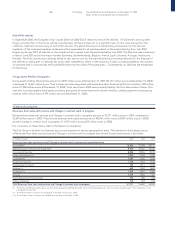
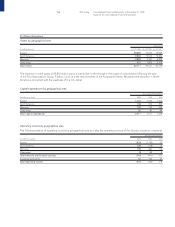
15 Value of production
Revenues from sales and services and Change in contract work in progress
Revenues from sales and services and Change in contract work in progress amount to 47,271 million euros in 2003 compared to
55,649 million euros in 2002. They include revenues from sales and services of 48,346 million euros (55,427 million euros in 2002)
and the change in contract work in progress of -1,075 million euros (222 million euros in 2002).
For comments on these items, refer to the Report on operations.
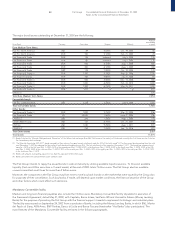
The Fiat Group is divided into business sectors and operates in various geographical areas. The distribution by business sector
of Revenues from sales and services and Change in contract work in progress (net of intra-Group transactions) is as follows:
(in millions of euros) 2003 2002 2001
Revenues from sales and services and Change in contract work in progress by operating sector
Automobiles 19,839 21,908 24,177
Agricultural and Construction Equipment 9,410 10,502 10,762
Commercial Vehicles 8,206 8,816 8,120
Ferrari and Maserati (*) 1,250 1,194 1,040
Components 2,087 2,085 2,438
Production Systems 1,756 1,763 1,510
Metallurgical Products 735 1,411 1,429
Aviation (**) 625 1,532 1,632
Insurance (***) 1,654 4,834 5,369
Services 1,019 1,005 762
Publishing and Communications 372 346 334
Other companies 318 253 433
Total Revenues from sales and services and Change in contract work in progress 47,271 55,649 58,006
(*) The Ferrari and Maserati Sector figures are presented separately beginning from 2002. The corresponding figures for 2001, previously included under “Other companies”, were
consequently reclassified.
(**) The Aviation Sector’s revenues are included up to the date of sale (July 1, 2003).
(***) The Insurance Sector’s revenues are included up to the date of sale (May 2, 2003).